/ZF or /ZN 20min Trading Setup For ThinkOrSwim

JoeDV

Active member
VIP
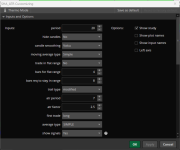
Just posting for anyone who might be interested that trades /ZF or /ZN. Here's a pretty simple setup I've been using for a little while. Is it perfect, not at all. Essentially, I only trade during the day when I have time. So, I don't take a trade until 8:30 am and I close out my position by 2:30 pm. Below are some program results for the last 10 days as well as 180 days. Values don't include the fees TD charges for each round-trip (about $6/per) Obviously, actual trades are likely to be different, some better, some worse.

http://tos.mx/l21lCSK - link to setup

10 days

kvZbASx.png


180 Days

NCkjKzF.png
 

Join useThinkScript to post your question to a community of 21,000+ developers and traders.

What period are you using on the HA indicator? Looks nice on the 20 min candle. I've used it extensively in the past on 2 min candles to trade /ES and had decent results. Thanks for posting.
 
What period are you using on the HA indicator? Looks nice on the 20 min candle. I've used it extensively in the past on 2 min candles to trade /ES and had decent results. Thanks for posting.
I used this HA indicator with RSI. Long if RSI > 50 and short if RSI < 50.
 
Not sure if you confirm the direction using the 20-min and trade off a lower time frame but from what I've seen so far for this product the tick charts (3200 vs 512) appear to provide good direction. I might research this a bit further and if feasible, automate in NT8.
 
question. What are the white arrows for? I thought they were exit signals but it moves to the next candle
Blue arrows are Buy/Sell and the white-gray arrows are the stops (exits). Not sure what you mean by it moves to the next candle other than the entry and exit prices are set to be the open of the next candle since the signal isn't "confirmed" until the next candle opens.


and also the dotted line green and red what are those for?
Green lines show the price that is used for a buy and the red line for a sell. Just a visual indicator that follows each candle to show what the trade-open price is. Perhaps you can see it better in this daily stock chart since it's tough to see when there aren't a lot of candles between trades.

TYzDEyz.png
 
Blue arrows are Buy/Sell and the white-gray arrows are the stops (exits). Not sure what you mean by it moves to the next candle other than the entry and exit prices are set to be the open of the next candle since the signal isn't "confirmed" until the next candle opens.


Green lines show the price that is used for a buy and the red line for a sell. Just a visual indicator that follows each candle to show what the trade-open price is. Perhaps you can see it better in this daily stock chart since it's tough to see when there aren't a lot of candles between trades.

TYzDEyz.png
ok great, I get the red and green dotted lines but I am still struggling with the white arrow. this arrow has been on every candle and moved to the next candle after the shot sell (blue arrow) triggered it moved 14 candles and only now has it stopped shifting to the next candle. Is it supposed top do that? this looks nice and thank you for your hard work
 
ok great, I get the red and green dotted lines but I am still struggling with the white arrow. this arrow has been on every candle and moved to the next candle after the shot sell (blue arrow) triggered it moved 14 candles and only now has it stopped shifting to the next candle. Is it supposed top do that? this looks nice and thank you for your hard work

Can you post a pic of what you're saying? And your settings. The white arrow is a stop and shouldn't be on successive candles.
 
Can you post a pic of what you're saying? And your settings. The white arrow is a stop and shouldn't be on successive candles.
Confirmed the stops/exits keep moving to the next candle. A screenshot will not show what is happening. You have to see it in real-time. As an example, today in /ZN a buy stop alert was triggered at the 10am PT candle, but the actual arrow and $ amount keeps moving to the next candle. There must be some error in the way the stops/exits are coded.
 
Confirmed the stops/exits keep moving to the next candle. A screenshot will not show what is happening. You have to see it in real-time. As an example, today in /ZN a buy stop alert was triggered at the 10am PT candle, but the actual arrow and $ amount keeps moving to the next candle. There must be some error in the way the stops/exits are coded.
As a follow up, the stop/exit arrow goes back to the correct candle once the market has closed.
 
Quick question, if a signal occurs in the overnight session and is valid at open does the algo take the position?
 
Quick question, if a signal occurs in the overnight session and is valid at open does the algo take the position?

No. If you define market/trading hours, it will only mark a signal the first time it occurs after the open.
 
Just posting for anyone who might be interested that trades /ZF or /ZN. Here's a pretty simple setup I've been using for a little while. Is it perfect, not at all. Essentially, I only trade during the day when I have time. So, I don't take a trade until 8:30 am and I close out my position by 2:30 pm. Below are some program results for the last 10 days as well as 180 days. Values don't include the fees TD charges for each round-trip (about $6/per) Obviously, actual trades are likely to be different, some better, some worse.

http://tos.mx/l21lCSK - link to setup

10 days

kvZbASx.png


180 Days

NCkjKzF.png
Hi! this script is amazing, I would like to add another label "expetected value of the strategy" but Ineed help whith the code. I don´t known how calculate "avg loss" of the strategy. Thanks and good trade.
 
Hi! this script is amazing, I would like to add another label "expetected value of the strategy" but Ineed help whith the code. I don´t known how calculate "avg loss" of the strategy. Thanks and good trade.


I'm not sure I understand what you mean by avg loss. Be glad to help if you could provide an example or something to help me grasp what you're trying to show. Thanks.

Also, if you add this by overwriting everything from # Total Profit or Loss down, it'll add a couple more labels (MaxUpPl and MaxDnPl) for the period you're viewing.

Code:
# Total Profit or Loss
def profitLossSum = compoundValue(1, if isNaN(isOrder)  or barnumber()==1 then 0 else if isOrder then profitLossSum[1] + profitLoss else profitLossSum[1], 0);

# How many trades won or lost
def profitWinners = compoundValue(1, if isNaN(profitWinners[1]) or barnumber()==1 then 0 else if isOrder and profitLoss > 0 then profitWinners[1] + 1 else profitWinners[1], 0);
def profitLosers = compoundValue(1, if isNaN(profitLosers[1])  or barnumber()==1 then 0 else if isOrder and profitLoss < 0 then profitLosers[1] + 1 else profitLosers[1], 0);
def profitPush = compoundValue(1, if isNaN(profitPush[1])  or barnumber()==1 then 0 else if isOrder and profitLoss == 0 then profitPush[1] + 1 else profitPush[1], 0);

# Current Open Trade Profit or Loss
def TradePL = If isLong then Round(((close - orderprice)/TickSize())*TickValue()) else if isShort then Round(((orderPrice - close)/TickSize())*TickValue()) else 0;

# Convert to actual dollars based on Tick Value for bubbles
def dollarProfitLoss = if orderPRice[1]==0 or isNaN(orderPrice[1]) then 0 else round((profitLoss/Ticksize())*Tickvalue());

# Closed Orders dollar P/L
def dollarPLSum = round((profitLossSum/Ticksize())*Tickvalue());
def maxUpSum = compoundValue(1, if isNan(maxUpSum[1]) or barnumber()==1 then 0 else if dollarPLSum > 0 AND dollarPLSum > maxUpSum[1] then dollarPLSum else maxUpSum[1],0);
def maxDnSum = compoundValue(1, if isNan(maxDnSum[1]) or barnumber()==1 then 0 else if dollarPLSum < 0 AND dollarPLSum < maxDnSum[1] then dollarPLSum else maxDnSum[1],0);

# Split profits or losses by long and short trades
def profitLong = compoundValue(1, if isNan(profitLong[1])  or barnumber()==1 then 0 else if isOrder and isLong[1] then profitLong[1]+dollarProfitLoss else profitLong[1],0);
def profitShort = compoundValue(1, if isNan(profitShort[1])  or barnumber()==1 then 0 else if isOrder and isShort[1] then profitShort[1]+dollarProfitLoss else profitShort[1],0);
def countLong = compoundValue(1, if isNaN(countLong[1])  or barnumber()==1 then 0 else if isOrder and isLong[1] then countLong[1]+1 else countLong[1],0);
def countShort = compoundValue(1, if isNaN(countShort[1])  or barnumber()==1 then 0 else if isOrder and isShort[1] then countShort[1]+1 else countShort[1],0);

# What was the biggest winning and losing trade
def biggestWin = compoundValue(1, if isNaN(biggestWin[1]) or barnumber()==1 then 0 else if isOrder and (dollarProfitLoss > 0) and (dollarProfitLoss > biggestWin[1]) then dollarProfitLoss else biggestWin[1], 0);
def biggestLoss = compoundValue(1, if isNaN(biggestLoss[1]) or barnumber()==1 then 0 else if isOrder and (dollarProfitLoss < 0) and (dollarProfitLoss < biggestLoss[1]) then dollarProfitLoss else biggestLoss[1], 0);

def ClosedTradeCount = if (isLong or isShort) then orderCount-1 else orderCount;
def OpenTrades = if (isLong or isShort) then 1 else 0;

def FuturesCommission = 6*ClosedTradeCount;


# What percent were winners
def PCTWin = if (OpenTrades and (TradePL < 0)) then round((profitWinners/(ClosedTradeCount+1))*100,2)
else if (OpenTrades and (TradePL > 0)) then round(((profitWinners+1)/(ClosedTradeCount+1))*100,2) else round(((profitWinners)/(ClosedTradeCount))*100,2) ;

# Average trade
def avgTrade = if (OpenTrades and (TradePL < 0)) then round(((dollarPLSum - TradePL)/(ClosedTradeCount+1)),2)
else if (OpenTrades and (TradePL > 0)) then round(((dollarPLSum + TradePL)/(ClosedTradeCount+1)),2) else round(((dollarPLSum)/(ClosedTradeCount)),2) ;


#######################################
##  Create Labels
#######################################


AddLabel(showLabels and isIntraDay, if MarketOpen then "Market Open" else "Market Closed", color.white);
AddLabel(showLabels, GetSymbol()+" Tick Size: "+TickSize()+" Value: "+TickValue(), color.white);
AddLabel(showLabels and (LongTrades and ShortTrades), "Long+Short Trades", color.white);
AddLabel(showLabels and (LongTrades and !ShortTrades),"Long Trades Only", color.white);
AddLabel(showLabels and (!LongTrades and ShortTrades),"Short Trades Only", color.white);
AddLabel(showLabels and (tradeDaytimeOnly),"Daytime Only", color.white);
AddLabel(showLabels and (UseFuturesFees),"Future Fees Incl", color.white);

AddLabel(showLabels, "Closed Orders: " + ClosedTradeCount + " P/L: " + AsDollars(dollarPLSum - if UseFuturesFees then FuturesCommission else 0), if dollarPLSum > 0 then Color.GREEN else if dollarPLSum< 0 then Color.RED else Color.GRAY);

AddLabel(if !IsNan(orderPrice) and showLabels then 1 else 0, "Closed+Open P/L: "+ AsDollars(TradePL+dollarPLSum - if UseFuturesFees then FuturesCommission else 0), if ((TradePL+dollarPLSum) > 0) then color.green else if ((TradePL+dollarPLSum - if UseFuturesFees then FuturesCommission else 0) < 0) then color.red else color.gray);

AddLabel(showLabels, "Avg per Trade: "+ AsDollars(avgTrade  - if UseFuturesFees then 6 else 0), if avgTrade > 0 then Color.Green else if avgTrade < 0 then Color.RED else Color.GRAY);
AddLabel(showLabels, "Winners: "+ PCTWin +"%",if PCTWin > 50 then color.green else if PCTWin > 40 then color.yellow else color.gray);

AddLabel(showLabels, "Long Profit: " +AsDollars(profitLong), if profitLong > 0 then color.green else if profitLong < 0 then color.red else color.gray);
AddLabel(showLabels, "Short Profit: " +AsDollars(profitShort), if profitShort > 0 then color.green else if profitShort < 0 then color.red else color.gray);

AddLabel(showLabels, "MaxUpTrade: "+ AsDollars(biggestWin) +" MaxDownTrade: "+AsDollars(biggestLoss), color.white);
AddLabel(showLabels, "MaxUpPL: "+ AsDollars(maxUpSum) +" MaxDownPL: "+AsDollars(maxDnSum), color.white);

AddLabel(if !IsNan(CurrentPosition) and showLabels and OpenTrades then 1 else 0, "Open: "+ (If isLong then "Bought" else "Sold") + " @ "+orderPrice, color.white);
AddLabel(if !IsNan(orderPrice) and showLabels and OpenTrades then 1 else 0, "Open Trade P/L: "+ AsDollars(TradePL), if (TradePL > 0) then color.green else if (TradePl < 0) then color.red else color.gray);


#######################################
##  Chart Bubbles for Profit/Loss
#######################################


AddChartBubble(showSignals and showBubbles and isOrder and isLong[1], low, "$"+dollarProfitLoss, if dollarProfitLoss == 0 then Color.LIGHT_GRAY else if dollarProfitLoss > 0 then Color.GREEN else color.Red, 0);
AddChartBubble(showSignals and showBubbles and isOrder and isShort[1], high,  "$"+dollarProfitLoss, if dollarProfitLoss == 0 then Color.LIGHT_GRAY else if dollarProfitLoss > 0 then Color.GREEN else color.Red, 1);
 
Last edited by a moderator:

Not the exact question you're looking for?

Start a new thread and receive assistance from our community.

87k+ Posts
431 Online
Create Post

The Market Trading Game Changer

Join 2,500+ subscribers inside the useThinkScript VIP Membership Club
  • Exclusive indicators
  • Proven strategies & setups
  • Private Discord community
  • ‘Buy The Dip’ signal alerts
  • Exclusive members-only content
  • Add-ons and resources
  • 1 full year of unlimited support

Frequently Asked Questions

What is useThinkScript?

useThinkScript is the #1 community of stock market investors using indicators and other tools to power their trading strategies. Traders of all skill levels use our forums to learn about scripting and indicators, help each other, and discover new ways to gain an edge in the markets.

How do I get started?

We get it. Our forum can be intimidating, if not overwhelming. With thousands of topics, tens of thousands of posts, our community has created an incredibly deep knowledge base for stock traders. No one can ever exhaust every resource provided on our site.

If you are new, or just looking for guidance, here are some helpful links to get you started.

What are the benefits of VIP Membership?
VIP members get exclusive access to these proven and tested premium indicators: Buy the Dip, Advanced Market Moves 2.0, Take Profit, and Volatility Trading Range. In addition, VIP members get access to over 50 VIP-only custom indicators, add-ons, and strategies, private VIP-only forums, private Discord channel to discuss trades and strategies in real-time, customer support, trade alerts, and much more. Learn all about VIP membership here.
How can I access the premium indicators?
To access the premium indicators, which are plug and play ready, sign up for VIP membership here.
Back
Top