

YOUR ROCK LANDS IN THE WATER AND CREATES TIMEFRAMES
A simple tutor for new traders.
A simple tutor for new traders.
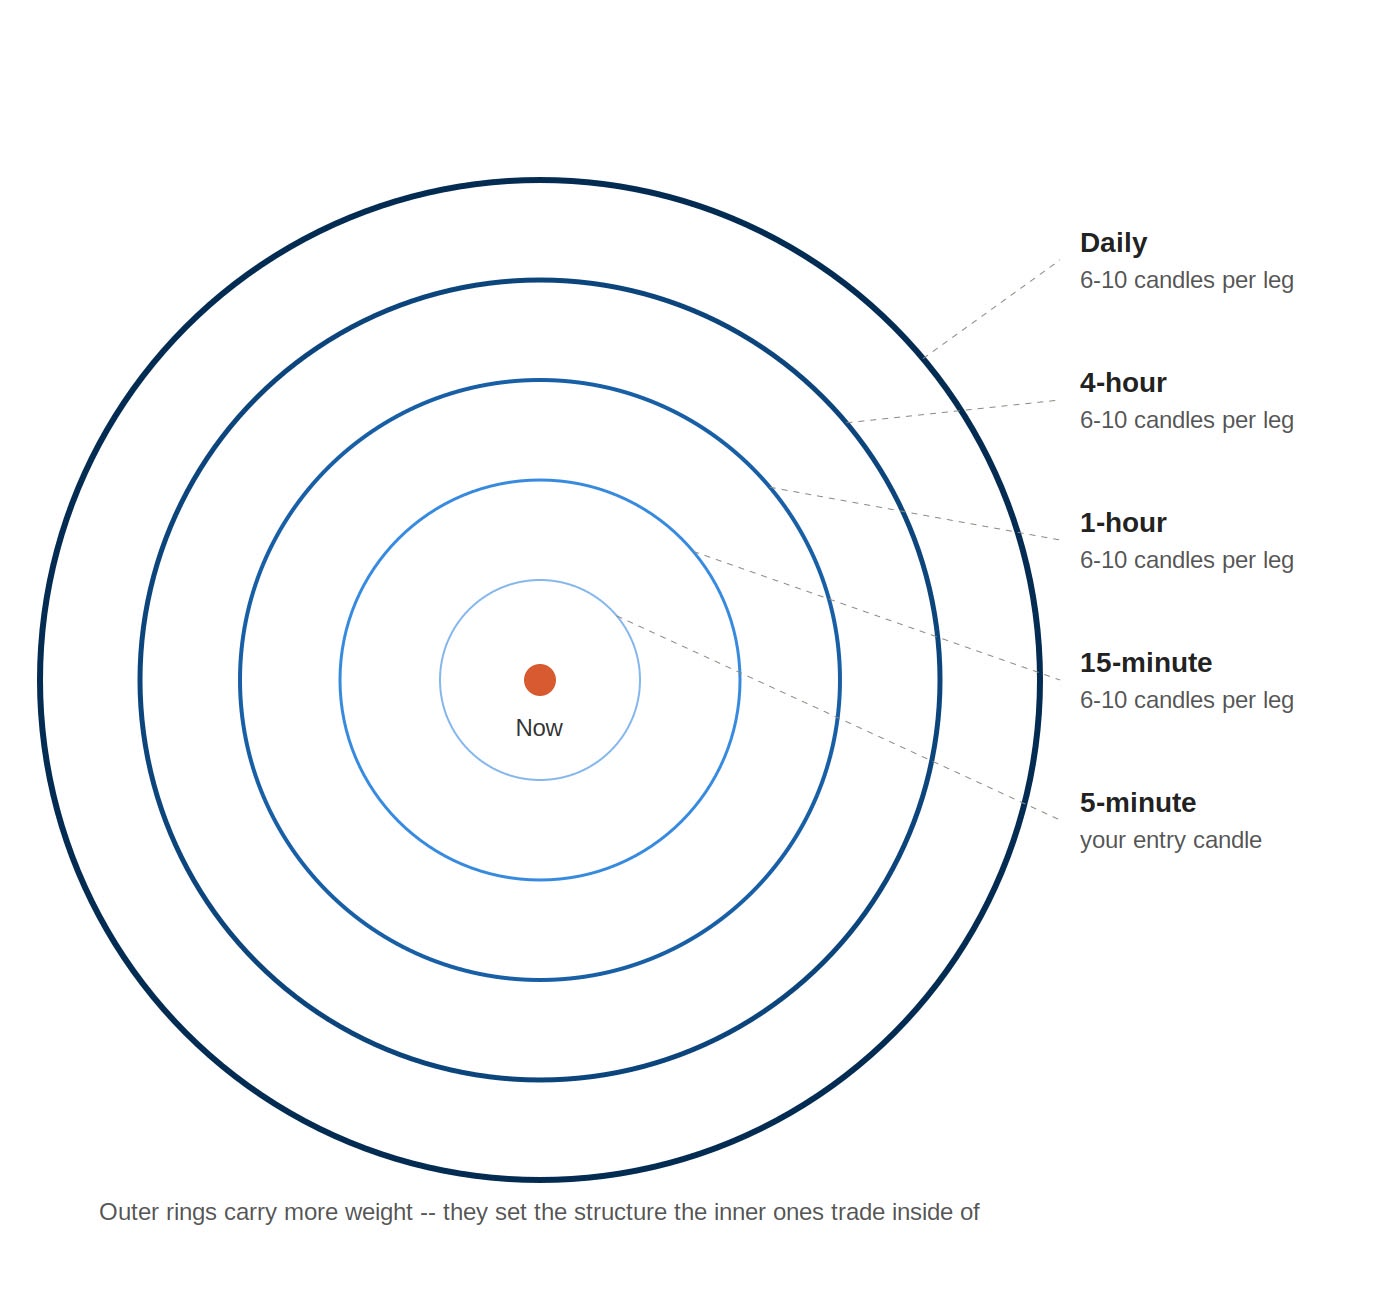
When you drop a rock in still water, the splash point is your current candle — right now, this moment on the chart. But that splash didn't just happen in isolation. It's actually the echo of bigger waves that were already moving through the pool before your rock ever landed — the tide, the wake of bigger boats, waves from farther out. Each ring you see moving outward from your entry candle represents a bigger timeframe — 5-min, 15-min, hourly, daily — and here's the key: the bigger the ring, the more water it's pushing, the more it dictates what your little splash is allowed to do. You don't trade the splash. You trade knowing which ring you're standing inside of.
And each of those rings — each timeframe — tends to take roughly 6 to 10 candles to fully form before it hands off to the next one out.
The 6–10 candle rule specifically is a a reasonable, commonly-taught heuristic (a practical rule of thumb to make a decision quickly) which you’ll frequently see it in various swing-trading and Elliott-wave-adjacent frameworks for how many bars it typically takes to complete a leg/swing before the structure "resolves" into what shows up as a single move on the next timeframe up. The six to ten candles is a tendency, not a law — it holds up better in liquid, trending names and gets noisier in low-volume or choppy conditions. It is "usually, not always," and usually survives in context with real charts better.
Here is a simple visual with the dropped rock, expanding rings labeled with timeframes, with candle counts annotated on each ring — which gives a simple view of the process.
I hope this visual helps?
Last edited by a moderator:
