
Depends on your trading style whether its short or long term.For the buy/sell tab inside the watch list, which timeframe is this best used for?
You are using an out of date browser. It may not display this or other websites correctly.
You should upgrade or use an alternative browser.
You should upgrade or use an alternative browser.
Xtreme Vortex Bundle Indicator for ThinkorSwim
- Thread starter chewie76
- Start date
Join useThinkScript to post your question to a community of 21,000+ developers and traders.
@chewie76 can you send me the code for the lower indicator? I don't know if the sharing links are still messed up or what but i just get a blank screen when i click the links. thanks!This is TOS's standard Vortex Indicator with a new XTREME twist.
What's new? I added a yellow midline. I added upper and lower gray target lines that you can change in the input settings based on your trading style. Default settings are 0.80 for the lower target and 1.15 for the upper target. When the Vortex lines have extended past the target lines, you will see these dots on the midline. There are 4 colored dots. Pink = caution sell, red = sell, light green = caution buy, and green = buy. The "caution" dots can be turned on/off in the input settings. In the upper indictor, instead of dots, they are arrows. The "caution" arrows can be turned on/off in the input settings of the upper chart.
There are also colored candles included with this indicator that can be turned on/off in the input settings. There are 4 colors. Green is strong buying, light green is weak buying, red is strong selling and yellow is weak selling.
NOTE: No indicator is perfect. You will notice when there is MAJOR buying or MAJOR selling, you will see reversal signals, yet the stock will continue going in the direction of the trend. In this case, placing a sell order below the previous candle's low on an uptrend and a buy order above the previous candle's high on a downtrend may be a good entry strategy.
Here is an example of /ES. The first picture includes the caution signals, the second picture removes the caution signals.


Upper Indicator Code:
http://tos.mx/LQi09gj
Lower Indicator Code:
http://tos.mx/kd5erZ0
The next question people ask is, "Can you send a Watchlist Column?" Yes, here you go. Default setting is 15 minutes. To change the time, click on heading and select Edit Formula. The "caution" indicators can also be turned on/off in the input settings.
Watchlist Column:
http://tos.mx/JqMuz0P

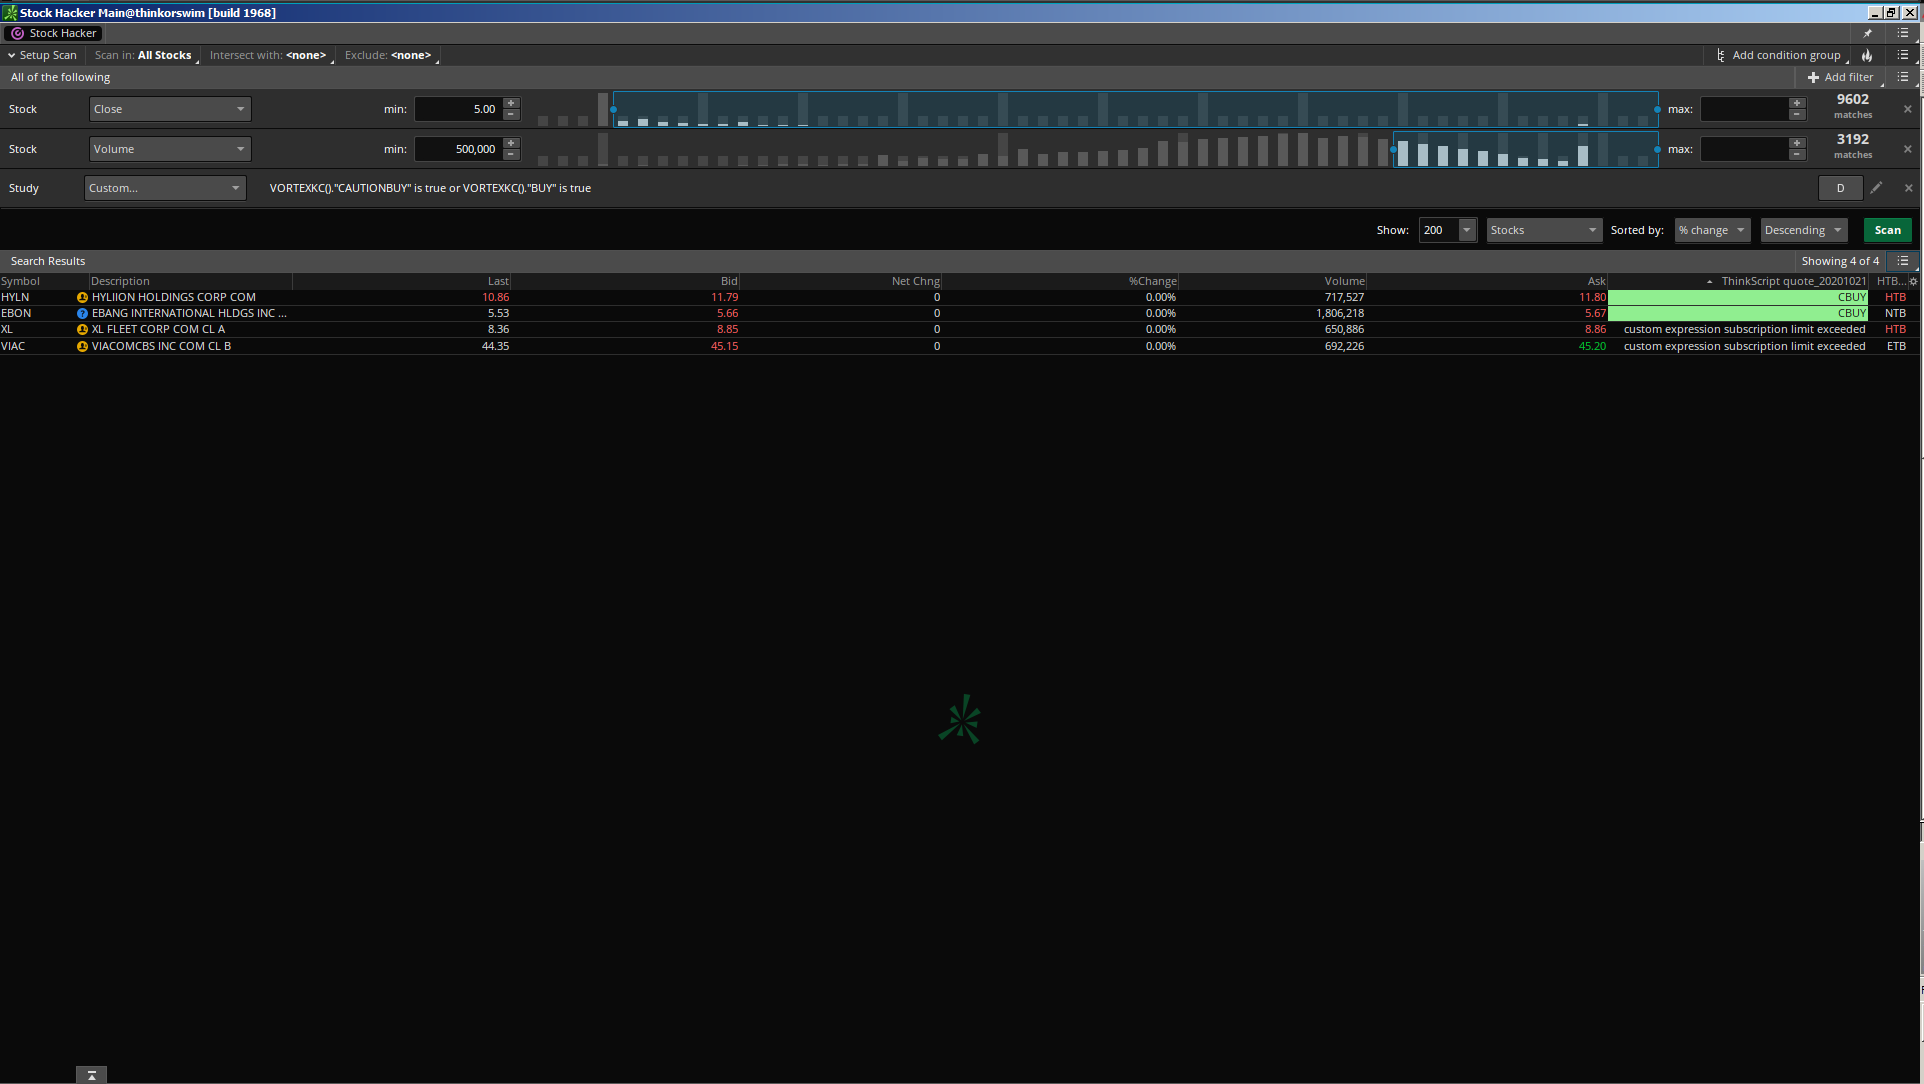
The next question people ask is, "Can you send a Scan?" Yes, here you go.
Buy Scan:
http://tos.mx/YMMcu1E

Sell Scan:
http://tos.mx/8n5jQgH

Enjoy!
@chewie76 can you send me the code for the lower indicator? I don't know if the sharing links are still messed up or what but i just get a blank screen when i click the links. thanks!
Same - clicking the share links I just get a blank screen. Tried it on multiple browsers, and after a system reboot. Any info would be appreciated.
Hello chewie76This is TOS's standard Vortex Indicator with a new XTREME twist.
What's new? I added a yellow midline. I added upper and lower gray target lines that you can change in the input settings based on your trading style. Default settings are 0.80 for the lower target and 1.15 for the upper target. When the Vortex lines have extended past the target lines, you will see these dots on the midline. There are 4 colored dots. Pink = caution sell, red = sell, light green = caution buy, and green = buy. The "caution" dots can be turned on/off in the input settings. In the upper indictor, instead of dots, they are arrows. The "caution" arrows can be turned on/off in the input settings of the upper chart.
There are also colored candles included with this indicator that can be turned on/off in the input settings. There are 4 colors. Green is strong buying, light green is weak buying, red is strong selling and yellow is weak selling.
NOTE: No indicator is perfect. You will notice when there is MAJOR buying or MAJOR selling, you will see reversal signals, yet the stock will continue going in the direction of the trend. In this case, placing a sell order below the previous candle's low on an uptrend and a buy order above the previous candle's high on a downtrend may be a good entry strategy.
Here is an example of /ES. The first picture includes the caution signals, the second picture removes the caution signals.


Upper Indicator Code:
http://tos.mx/J2R9JjS
UPPER CODE:
#XTREME VORTEX Indicator Upper
#assembled by Chewie
#available on UseThinkScript.com
#https://usethinkscript.com/threads/xtreme-vortex-bundle-indicator-for-thinkorswim.4218/
declare UPPER;
input length = 14;
input Lower = 0.80;
input Upper = 1.15;
input Caution = yes;
input Price_Color = no;
def trSum = sum(TrueRange(high, close, low), length);
def "VI+" = if trSum == 0 then 0 else sum(AbsValue(high - low[1]), length) / trSum;
def "VI-" = if trSum == 0 then 0 else sum(AbsValue(low - high[1]), length) / trSum;
def MIDDLE = 1;
#Candle Colors
assignpriceColor(if Price_Color AND "VI+" > "VI-" then color.dark_green else color.current);
assignpriceColor(if Price_Color AND "VI+" < "VI-" then color.red else color.current);
assignpriceColor(if Price_Color AND "VI+" > "VI-" AND "VI+" < "VI+"[1] then color.light_green else color.current);
assignpriceColor(if Price_Color AND "VI+" < "VI-" AND "VI-" < "VI-"[1] then color.yellow else color.current);
# Plot Arrows
plot BUY = "VI+" <= lower and "VI-" >= upper and "VI+" > "VI+"[1] and "VI-" < "VI-"[1];
BUY.SetPaintingStrategy(PaintingStrategy.BOOLEAN_ARROW_up);
BUY.SetDefaultColor(Color.DARK_GREEN);
BUY.setLineWeight(2);
plot SELL = "VI-" <= lower and "VI+" >= upper and "VI-" > "VI-"[1] and "VI+" < "VI+"[1];
SELL.SetPaintingStrategy(PaintingStrategy.BOOLEAN_ARROW_DOWN);
SELL.SetDefaultColor(Color.red);
SELL.setLineWeight(2);
plot CAUTIONBUY = caution and "VI+" <= lower and "VI-" >= upper;
CAUTIONBUY.SetPaintingStrategy(PaintingStrategy.BOOLEAN_ARROW_up);
CAUTIONBUY.SetDefaultColor(Color.LIGHT_GREEN);
CAUTIONBUY.setLineWeight(1);
plot CAUTIONSELL = caution and "VI-" <= lower and "VI+" >= upper;
CAUTIONSELL.SetPaintingStrategy(PaintingStrategy.BOOLEAN_ARROW_DOWN);
CAUTIONSELL.SetDefaultColor(Color.PINK);
CAUTIONSELL.setLineWeight(1);
Lower Indicator Code:
http://tos.mx/SDDSUTc
LOWER CODE:
#XTREME VORTEX Indicator
#assembled by Chewie
#available on UseThinkScript.com
#https://usethinkscript.com/threads/xtreme-vortex-bundle-indicator-for-thinkorswim.4218/
declare lower;
input length = 14;
input Lower = 0.80;
input Upper = 1.15;
input Caution = yes;
input Price_Color = yes;
def trSum = sum(TrueRange(high, close, low), length);
plot "VI+" = if trSum == 0 then 0 else sum(AbsValue(high - low[1]), length) / trSum;
plot "VI-" = if trSum == 0 then 0 else sum(AbsValue(low - high[1]), length) / trSum;
"VI+".SetDefaultColor(Color.GREEN);
"VI-".SetDefaultColor(Color.RED);
plot MIDDLE = 1;
MIDDLE.SetDefaultColor(Color.YELLOW);
plot LOW = LOWER;
LOW.SetDefaultColor(Color.GRAY);
plot HIGH = UPPER;
HIGH.SetDefaultColor(Color.GRAY);
#Candle Colors
assignpriceColor(if Price_Color AND "VI+" > "VI-" then color.dark_green else color.current);
assignpriceColor(if Price_Color AND "VI+" < "VI-" then color.red else color.current);
assignpriceColor(if Price_Color AND "VI+" > "VI-" AND "VI+" < "VI+"[1] then color.light_green else color.current);
assignpriceColor(if Price_Color AND "VI+" < "VI-" AND "VI-" < "VI-"[1] then color.yellow else color.current);
def condition1 = "VI+" <= lower and "VI-" >= upper and "VI+" > "VI+"[1] and "VI-" < "VI-"[1];
def condition2 = "VI-" <= lower and "VI+" >= upper and "VI-" > "VI-"[1] and "VI+" < "VI+"[1];
def condition3 = "VI+" <= lower and "VI-" >= upper;
def condition4 = "VI-" <= lower and "VI+" >= upper;
# Plot DOTS
plot BUY = if condition1 then condition1 else Double.NaN;
BUY.SetPaintingStrategy(PaintingStrategy.POINTS);
BUY.SetDefaultColor(Color.DARK_GREEN);
BUY.setLineWeight(4);
plot SELL = if condition2 then condition2 else Double.NaN;
SELL.SetPaintingStrategy(PaintingStrategy.POINTS);
SELL.SetDefaultColor(Color.red);
SELL.setLineWeight(4);
plot CAUTIONBUY = if caution and condition3 then condition3 else Double.NaN;
CAUTIONBUY.SetPaintingStrategy(PaintingStrategy.POINTS);
CAUTIONBUY.SetDefaultColor(Color.LIGHT_GREEN);
CAUTIONBUY.setLineWeight(4);
plot CAUTIONSELL = if caution and condition4 then condition4 else Double.NaN;
CAUTIONSELL.SetPaintingStrategy(PaintingStrategy.POINTS);
CAUTIONSELL.SetDefaultColor(Color.PINK);
CAUTIONSELL.setLineWeight(4);
#clouds
AddCloud("VI-", "VI+", Color.dark_RED, Color.CURRENT);
AddCloud("VI+", "VI-", Color.dark_GREEN, Color.CURRENT);
The next question people ask is, "Can you send a Watchlist Column?" Yes, here you go. Default setting is 15 minutes. To change the time, click on heading and select Edit Formula. The "caution" indicators can also be turned on/off in the input settings.
Watchlist Column:
http://tos.mx/JqMuz0P

The next question people ask is, "Can you send a Scan?" Yes, here you go.
Buy Scan:
http://tos.mx/YMMcu1E

Sell Scan:
http://tos.mx/8n5jQgH

Enjoy!
I new to the forum. I am confused with the dot colors. Do you buy a short position when the color is red and buy a long position when the color is green. Thank you in adavance.
Yes, that is correct.Hello chewie76
I new to the forum. I am confused with the dot colors. Do you buy a short position when the color is red and buy a long position when the color is green. Thank you in adavance.
I did see green dots yesterday starting around 3.00 PM EST on "SPY" five mins chart.
I did not see any green dots today even when the market is dropping around 3.00 PM

Whats the difference ?
Thanks
Does the color pattern for green and red apply to the dots as well. Looks like to is inverse.
I did not see any green dots today even when the market is dropping around 3.00 PM
Whats the difference ?
Thanks
Does the color pattern for green and red apply to the dots as well. Looks like to is inverse.
Yes. The dots apply to both red and green and the lines inverse. I suggest trying to change the length to 14 instead of 30. You will see more dots.I did see green dots yesterday starting around 3.00 PM EST on "SPY" five mins chart.
I did not see any green dots today even when the market is dropping around 3.00 PM

Whats the difference ?
Thanks
Does the color pattern for green and red apply to the dots as well. Looks like to is inverse.
Thank you. I am trying to use the extreme vortex indicator in conjunction with Williams alligator to help with entry and exit signals. Is it possible to modify the dots and arrow colors to generate buy and sell signals.Yes. The dots apply to both red and green and the lines inverse. I suggest trying to change the length to 14 instead of 30. You will see more dots.
Maybe you can set a trigger of a buy/sell signal at the first candle that does not have a dot.Thank you. I am trying to use the extreme vortex indicator in conjunction with Williams alligator to help with entry and exit signals. Is it possible to modify the dots and arrow colors to generate buy and sell signals.
@pleasantc
The solution is to use less Custom Watchlist Columns or limit the number of rows of data displayed... The maximum number of custom expressions is in the 1,100 - 1,500 range...
The solution is to use less Custom Watchlist Columns or limit the number of rows of data displayed... The maximum number of custom expressions is in the 1,100 - 1,500 range...
Last edited by a moderator:
coolcat7fl
New member
The solution is to use less Custom Watchlist Columns or limit the number of rows of data displayed... The maximum number of custom expressions is in the 1,100 - 1,500 range...
Unfortunately the max number applies to ALL open watchlists AND\OR Activity\Position screens - I use %change by 5m; day; week and month columns in both watchlists AND Monitor Tab- ACTIVITY\POSITION tab in 3 groups and run into the issue alot, the issue is worse in the Paper trading account.- just have to split BIG watchlists into smaller ones to get around it, or use less watchlists.
Last edited by a moderator:
Scott111111
New member
I reviewed this and loaded it into TOS, over the past few days it has done pretty well just reviewing crossing the 1.15 and .8. Is anyone using this indicator for trading with success?
can we create a scan that alert when the green line crosses the red line and vice-versa?This is TOS's standard Vortex Indicator with a new XTREME twist.
What's new? I added a yellow midline. I added upper and lower gray target lines that you can change in the input settings based on your trading style. Default settings are 0.80 for the lower target and 1.15 for the upper target. When the Vortex lines have extended past the target lines, you will see these dots on the midline. There are 4 colored dots. Pink = caution sell, red = sell, light green = caution buy, and green = buy. The "caution" dots can be turned on/off in the input settings. In the upper indictor, instead of dots, they are arrows. The "caution" arrows can be turned on/off in the input settings of the upper chart.
There are also colored candles included with this indicator that can be turned on/off in the input settings. There are 4 colors. Green is strong buying, light green is weak buying, red is strong selling and yellow is weak selling.
NOTE: No indicator is perfect. You will notice when there is MAJOR buying or MAJOR selling, you will see reversal signals, yet the stock will continue going in the direction of the trend. In this case, placing a sell order below the previous candle's low on an uptrend and a buy order above the previous candle's high on a downtrend may be a good entry strategy.
Here is an example of /ES. The first picture includes the caution signals, the second picture removes the caution signals.


Upper Indicator Code:
http://tos.mx/J2R9JjS
UPPER CODE:
#XTREME VORTEX Indicator Upper
#assembled by Chewie
#available on UseThinkScript.com
#https://usethinkscript.com/threads/xtreme-vortex-bundle-indicator-for-thinkorswim.4218/
declare UPPER;
input length = 14;
input Lower = 0.80;
input Upper = 1.15;
input Caution = yes;
input Price_Color = no;
def trSum = sum(TrueRange(high, close, low), length);
def "VI+" = if trSum == 0 then 0 else sum(AbsValue(high - low[1]), length) / trSum;
def "VI-" = if trSum == 0 then 0 else sum(AbsValue(low - high[1]), length) / trSum;
def MIDDLE = 1;
#Candle Colors
assignpriceColor(if Price_Color AND "VI+" > "VI-" then color.dark_green else color.current);
assignpriceColor(if Price_Color AND "VI+" < "VI-" then color.red else color.current);
assignpriceColor(if Price_Color AND "VI+" > "VI-" AND "VI+" < "VI+"[1] then color.light_green else color.current);
assignpriceColor(if Price_Color AND "VI+" < "VI-" AND "VI-" < "VI-"[1] then color.yellow else color.current);
# Plot Arrows
plot BUY = "VI+" <= lower and "VI-" >= upper and "VI+" > "VI+"[1] and "VI-" < "VI-"[1];
BUY.SetPaintingStrategy(PaintingStrategy.BOOLEAN_ARROW_up);
BUY.SetDefaultColor(Color.DARK_GREEN);
BUY.setLineWeight(2);
plot SELL = "VI-" <= lower and "VI+" >= upper and "VI-" > "VI-"[1] and "VI+" < "VI+"[1];
SELL.SetPaintingStrategy(PaintingStrategy.BOOLEAN_ARROW_DOWN);
SELL.SetDefaultColor(Color.red);
SELL.setLineWeight(2);
plot CAUTIONBUY = caution and "VI+" <= lower and "VI-" >= upper;
CAUTIONBUY.SetPaintingStrategy(PaintingStrategy.BOOLEAN_ARROW_up);
CAUTIONBUY.SetDefaultColor(Color.LIGHT_GREEN);
CAUTIONBUY.setLineWeight(1);
plot CAUTIONSELL = caution and "VI-" <= lower and "VI+" >= upper;
CAUTIONSELL.SetPaintingStrategy(PaintingStrategy.BOOLEAN_ARROW_DOWN);
CAUTIONSELL.SetDefaultColor(Color.PINK);
CAUTIONSELL.setLineWeight(1);
Lower Indicator Code:
http://tos.mx/SDDSUTc
LOWER CODE:
#XTREME VORTEX Indicator
#assembled by Chewie
#available on UseThinkScript.com
#https://usethinkscript.com/threads/xtreme-vortex-bundle-indicator-for-thinkorswim.4218/
declare lower;
input length = 14;
input Lower = 0.80;
input Upper = 1.15;
input Caution = yes;
input Price_Color = yes;
def trSum = sum(TrueRange(high, close, low), length);
plot "VI+" = if trSum == 0 then 0 else sum(AbsValue(high - low[1]), length) / trSum;
plot "VI-" = if trSum == 0 then 0 else sum(AbsValue(low - high[1]), length) / trSum;
"VI+".SetDefaultColor(Color.GREEN);
"VI-".SetDefaultColor(Color.RED);
plot MIDDLE = 1;
MIDDLE.SetDefaultColor(Color.YELLOW);
plot LOW = LOWER;
LOW.SetDefaultColor(Color.GRAY);
plot HIGH = UPPER;
HIGH.SetDefaultColor(Color.GRAY);
#Candle Colors
assignpriceColor(if Price_Color AND "VI+" > "VI-" then color.dark_green else color.current);
assignpriceColor(if Price_Color AND "VI+" < "VI-" then color.red else color.current);
assignpriceColor(if Price_Color AND "VI+" > "VI-" AND "VI+" < "VI+"[1] then color.light_green else color.current);
assignpriceColor(if Price_Color AND "VI+" < "VI-" AND "VI-" < "VI-"[1] then color.yellow else color.current);
def condition1 = "VI+" <= lower and "VI-" >= upper and "VI+" > "VI+"[1] and "VI-" < "VI-"[1];
def condition2 = "VI-" <= lower and "VI+" >= upper and "VI-" > "VI-"[1] and "VI+" < "VI+"[1];
def condition3 = "VI+" <= lower and "VI-" >= upper;
def condition4 = "VI-" <= lower and "VI+" >= upper;
# Plot DOTS
plot BUY = if condition1 then condition1 else Double.NaN;
BUY.SetPaintingStrategy(PaintingStrategy.POINTS);
BUY.SetDefaultColor(Color.DARK_GREEN);
BUY.setLineWeight(4);
plot SELL = if condition2 then condition2 else Double.NaN;
SELL.SetPaintingStrategy(PaintingStrategy.POINTS);
SELL.SetDefaultColor(Color.red);
SELL.setLineWeight(4);
plot CAUTIONBUY = if caution and condition3 then condition3 else Double.NaN;
CAUTIONBUY.SetPaintingStrategy(PaintingStrategy.POINTS);
CAUTIONBUY.SetDefaultColor(Color.LIGHT_GREEN);
CAUTIONBUY.setLineWeight(4);
plot CAUTIONSELL = if caution and condition4 then condition4 else Double.NaN;
CAUTIONSELL.SetPaintingStrategy(PaintingStrategy.POINTS);
CAUTIONSELL.SetDefaultColor(Color.PINK);
CAUTIONSELL.setLineWeight(4);
#clouds
AddCloud("VI-", "VI+", Color.dark_RED, Color.CURRENT);
AddCloud("VI+", "VI-", Color.dark_GREEN, Color.CURRENT);
The next question people ask is, "Can you send a Watchlist Column?" Yes, here you go. Default setting is 15 minutes. To change the time, click on heading and select Edit Formula. The "caution" indicators can also be turned on/off in the input settings.
Watchlist Column:
http://tos.mx/JqMuz0P

The next question people ask is, "Can you send a Scan?" Yes, here you go.
Buy Scan:
http://tos.mx/YMMcu1E

Sell Scan:
http://tos.mx/8n5jQgH

Enjoy!
can we create a scan that alert when the green line crosses the red line and vice-versa?
The next question people ask is, "Can you send a Scan?" Yes, here you go.
Buy Scan:
http://tos.mx/YMMcu1E
Sell Scan:
http://tos.mx/8n5jQgH
Need a little help. I'm trying to add arrows when the VI+ and VI- crosses above the 0.8 (lower) line. but my script creates arrows way above the indicators. Could someone show me what I'm doing wrong. This is the script that I have added to Chewie's (XTREME VORTEX indicator). Thanks
plot ArrowUp = if "VI+" crosses above LOWER then low else double.nan;
ArrowUp.setpaintingstrategy(paintingstrategy.boolean_arrow_up);
ArrowUP.SetLineWeight(3);
ArrowUp.SetDefaultColor(Color.GREEN);
plot ArrowUp1 = if "VI-" crosses above LOWER then low else double.nan;
ArrowUp1.setpaintingstrategy(paintingstrategy.boolean_arrow_up);
ArrowUP1.SetLineWeight(3);
ArrowUp1.SetDefaultColor(Color.red);
change "low" to "0.8".Need a little help. I'm trying to add arrows when the VI+ and VI- crosses above the 0.8 (lower) line. but my script creates arrows way above the indicators. Could someone show me what I'm doing wrong. This is the script that I have added to Chewie's (XTREME VORTEX indicator). Thanks
plot ArrowUp = if "VI+" crosses above LOWER then low else double.nan;
ArrowUp.setpaintingstrategy(paintingstrategy.boolean_arrow_up);
ArrowUP.SetLineWeight(3);
ArrowUp.SetDefaultColor(Color.GREEN);
plot ArrowUp1 = if "VI-" crosses above LOWER then low else double.nan;
ArrowUp1.setpaintingstrategy(paintingstrategy.boolean_arrow_up);
ArrowUP1.SetLineWeight(3);
ArrowUp1.SetDefaultColor(Color.red);
Not the exact question you're looking for?
Start a new thread and receive assistance from our community.
87k+
Posts
1369
Online
The Market Trading Game Changer
Join 2,500+ subscribers inside the useThinkScript VIP Membership Club
- Exclusive indicators
- Proven strategies & setups
- Private Discord community
- ‘Buy The Dip’ signal alerts
- Exclusive members-only content
- Add-ons and resources
- 1 full year of unlimited support
Frequently Asked Questions
What is useThinkScript?
useThinkScript is the #1 community of stock market investors using indicators and other tools to power their trading strategies. Traders of all skill levels use our forums to learn about scripting and indicators, help each other, and discover new ways to gain an edge in the markets.
How do I get started?
We get it. Our forum can be intimidating, if not overwhelming. With thousands of topics, tens of thousands of posts, our community has created an incredibly deep knowledge base for stock traders. No one can ever exhaust every resource provided on our site.
If you are new, or just looking for guidance, here are some helpful links to get you started.
- The most viewed thread:
https://usethinkscript.com/threads/repainting-trend-reversal-for-thinkorswim.183/ - Our most popular indicator:
https://usethinkscript.com/threads/buy-the-dip-indicator-for-thinkorswim.3553/ - Answers to frequently asked questions:
https://usethinkscript.com/threads/answers-to-commonly-asked-questions.6006/
What are the benefits of VIP Membership?
VIP members get exclusive access to these proven and tested premium indicators: Buy the Dip, Advanced Market Moves 2.0, Take Profit, and Volatility Trading Range. In addition, VIP members get access to over 50 VIP-only custom indicators, add-ons, and strategies, private VIP-only forums, private Discord channel to discuss trades and strategies in real-time, customer support, trade alerts, and much more. Learn all about VIP membership here.
How can I access the premium indicators?
To access the premium indicators, which are plug and play ready, sign up for VIP membership here.