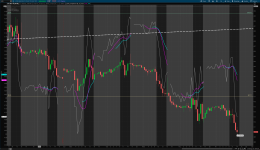
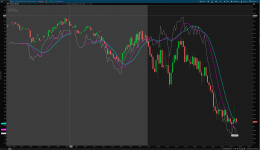
This XIV indicator is basically an inversion of the /VX which is the futures version of VIX that runs 22.5 hours/5 days a week plus Sunday night. It's a simple indicator but quite useful at spotting key turning points on any time frame chart for SPY and SPX. I use it as an overlay - please remember to set it up to run on the Left Axis.
This indicator can also be used as a divergent indicator: when it's going down as price is going up or vice versa.


This indicator can also be used as a divergent indicator: when it's going down as price is going up or vice versa.
Code:
#XIV_Comparison
#plots the inverse of the VIX with two averages
#Uses /VX futures instead of VIX to get 22.5/5 response
#Be sure to plot on the Left Axis if doing an overlay

input Period1 = 8;
input Period2 = 13;

plot xiv = 1/Close("/VX");

xiv.SetPaintingStrategy(paintingStrategy.Line);
xiv.SetLineWeight(1);
xiv.SetDefaultColor(Color.white);

plot XivAvg1 = Average(xiv, Period1);

XivAvg1.SetPaintingStrategy(paintingStrategy.Line);
XivAvg1.SetLineWeight(2);
XivAvg1.SetDefaultColor(Color.magenta);

plot XivAvg2 = Average(xiv, Period2);

XivAvg2.SetPaintingStrategy(paintingStrategy.Line);
XivAvg2.SetLineWeight(2);
XivAvg2.SetDefaultColor(Color.cyan);

#END CODE

Last edited:
