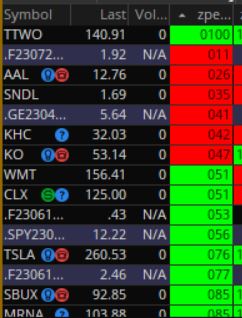
Good Day UseThinkScript Community,
I have a Watchlist script pasted below that displays the % of the ask between yesterday's high & today's low. I'm hoping someone can help me with a couple simple format changes to the code:
1.) Display the number as a percentage with zero decimal places
2.) Display the number green if 25% or greater and red if less than 25%
plot myindicator= (ask - low(period = "day" )[0]) / (high(period = "day" )[1]
- low(period = "day" )[0]);
Thanks for your time!
ST