VWAP difference between ToS and TradingSim

ztrader

New member
Hello all,

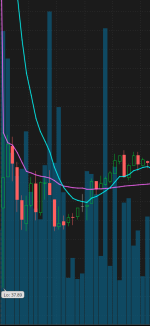
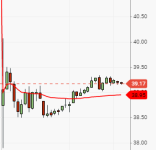
I use tradingsim and thinkorswim for my strategy backtesting. I use the VWAP indicator for one of my strategies, however the VWAP plot is different on these two platforms.

I think the reason is if the VWAP on thinkonswim uses the HIGH price and VWAP on tradingism uses the Open price for its parameters. I have attached a photo from the two platforms that illustrates this perfectly. Any clarification for the difference?

Any opinions on how to fix this so they are showing the same VWAP?

rQEyGnM.png


5HwVz5z.png
 

Attachments

  • rQEyGnM.png
    rQEyGnM.png
    25.3 KB · Views: 82
  • 5HwVz5z.png
    5HwVz5z.png
    8.6 KB · Views: 67
Last edited:

Join useThinkScript to post your question to a community of 21,000+ developers and traders.

imo, there's no one best way to calculate vwap, heres an example for tos.

Code:
# VWAPALOOZA
# By Prospectus @ http://readtheprospectus.worspress.com
#
# This Thinkscript calculates four different types of VWAP:
# OneDay (standard type), Rolling (N bar lookback), Bar
# Incremental (discrete N bar periods) and Volume Incremental
# (discrete N-shares-traded periods).
#
declare upper;
#
# Check if we are on the current day:
#
def istoday = if getDay() == getLastDay() then 1 else 0;
#
# Input Rolling / Incremental period, VWAP type, and
# Averaging method ( (H+L)/2 or Close):
#
input Period = 20;
def n = Period;
input VolIncrement=20000;
def v=VolIncrement;
input VWAPType = {Rolling, BarIncremental, VolIncremental, default OneDay};
def type;
switch (VWAPType){
case Rolling:
type = 1;
case BarIncremental:
type = 0;
case OneDay:
type = 2;
case VolIncremental:
type=3;
}
input AverageMethod = {CLOSE, default H_L};
def num;
switch (AverageMethod){
case CLOSE:
num = close;
case H_L:
num = (high + low) / 2;
}
#
# Define volume for today only (other days zero):
#
def todayvol = if istoday then volume else 0;
#
# Calculate the P*V term for VWAP:
#
def pv = num * todayvol;
#
# Code for BarIncremental counter:
#
rec k = if k[1] == n then 1 else k[1] + 1;
#
# Code for VolIncremental volume sum:
#
rec volsum=if volsum[1]>v then volume else volsum[1]+volume;
#
# Code for VolIncremental price*volume:
#
rec pvsum =if volsum[1]>v then num*volume else pvsum[1] + num*volume;
#
# Now define the VolIncremental to display:
#
rec volinc=if volsum[1]==0 then num else if volsum[1]>v then pvsum[1]/volsum[1] else volinc[1];
#
# Now the final VWAP calculations:
#
rec calcVWAP = if type == 2 then TotalSum(pv) / TotalSum(todayvol) else if type == 1 then sum(num*volume, n) / sum(volume, n) else if type==3 then volinc else if type==0 and k == n then sum(num*volume, n) / sum(volume, n) else calcvwap[1];
#
# Define the plot:
#
plot VWAPALOOZA = calcvwap;
#
# Formatting:
#
VWAPALOOZA.setdefaultcolor(color.white);
VWAPALOOZA.setstyle(curve.long_dash);
VWAPALOOZA.setlineweight(3);
 
Why is my TOS VWAP different than my IB VWAP? Here are my TOS and interactive brokers VWAP next to each other.

Why are they different?

image.png


(VWAP is yellow)
 
Last edited by a moderator:
For those experiencing differences in VWAPs between platforms there are 3 reasons that can cause discrepancies: 1) The base formula driving the code is different (would be kind of rare for something as widely universal as VWAP, but not possible to rule out until you dive into their codes and know how the platform interprets them)... 2) The time at which your platform starts collecting data is different. I have used platforms that start new days directly at midnight on futures despite the "new day" for futures begins at 6pm EST on the previous day. An other example is whether your platform or indicator is considering only regular hours or extended hours in the VWAP calculation (whether you have pre-market hours shown on your chart or not)... 3) The actual data being collected is different. This would occur mainly in FX since there is no centralized market for volume and bid/ask prices beyond what your data provider receives in the way of orders, so they would naturally follow different data sets among different platforms. But it could occur in other markets on occasion as well caused by simple orderbook errors....

All of these possible problems makes backtesting and forwardtesting rather inconsistent, which can be frustrating when you think you have figured out a killer strategy but can't duplicate it on your other platform. Now for the possible solutions.... 1) Just use one platform for all of your charting. Pretty simple concept but if you're a tinker it is hard to do because you like to play with new set ups, new indicators, and of course, new platforms. This does not mean only TRADE on one platform, I recommend trading on multiple platforms to keep the account spread out, but just one platform telling you when to execute trades provides simplicity, stability, and consistency... 2) For all of my tinkers out there, develop a strategy for EACH platform. This is actually a concept I really like, as some platforms have some very special indicators or tools that others do not. For example TOS does not have bid/ask candles but someone else does. I could develop a strategy based on the new information I can gather with that new tool on the other platform while still using my already tested and true strategy on TOS at the same time. This could also get you a few different systems designed for specific market conditions. TOS for bullish trend trading, TradeStation for bearish trend trading, and TradingView for choppy market scalping. All up in front of you for when the market shows its hand.

Hope this moves you guys past the "problem" and gets you thinking about solutions and workarounds instead.
 
Hi, I have noticed that the VWAP value reported by TOS is different than that of 2 other platforms. StreetSmartEdge by Schwab and also TC2000 have the same values. Has anyone else noticed a difference in the values across different platforms. I thought the values would be the same. Any ideas on why TOS's values are different? I also checked it against tradestation. For comparison the values are as follows:
Ticker = Spy on 11-19-20 at 9:36 StreetSmartEdge = 355.12
Tradestation = 355.08
ThinkorSwim = 354.90
Thanks
 
Last edited:
Hi, @rad14733, It is on a 1 minute chart and TOS was extended hrs selected, SSE and Tradestation were premarket only. I went and changed SSE and Tradestation to Pre and Post market and the values are still different. Todays values at 8:17pm 11-20-20 on TOS = 356.36, TS = 356.07, SSE = 356.64
Thanks
Are the different platforms getting their data from the same exchanges...??? There could be some minor variation between exchange prices... Latency can also come into play... Real-Time really isn't... Food for thought...
 
Thanks for the replies, but I do not know where their data source is coming from
No problem... Just pointing out potential reasons for discrepancies... If things were WAY off I'd suspect a coding issue but minor differences between platforms wouldn't be uncommon...
 
@codydog I have added deviation lines & Clouds

Code:
# VWAPALOOZA
# By Prospectus @ http://readtheprospectus.worspress.com
#
# This Thinkscript calculates four different types of VWAP:
# OneDay (standard type), Rolling (N bar lookback), Bar
# Incremental (discrete N bar periods) and Volume Incremental
# (discrete N-shares-traded periods).
#H Kaczmarczyk added Deviation Lines & Clouds
declare upper;
#
# Check if we are on the current day:
#
def istoday = if getDay() == getLastDay() then 1 else 0;
#
# Input Rolling / Incremental period, VWAP type, and
# Averaging method ( (H+L)/2 or Close):
#
input Period = 20;
input DPeriod = 20;
input VWAPStdev1 = 1.0;
input VWAPStdev2 = 2.0;
input VWAPStdev3 = 3.0;

def n = Period;
input VolIncrement=20000;
def v=VolIncrement;
input VWAPType = {Rolling, BarIncremental, VolIncremental, default OneDay};
def type;
switch (VWAPType){
case Rolling:
type = 1;
case BarIncremental:
type = 0;
case OneDay:
type = 2;
case VolIncremental:
type=3;
}
input AverageMethod = {CLOSE, default H_L};
def num;
switch (AverageMethod){
case CLOSE:
num = close;
case H_L:
num = (high + low) / 2;
}
#
# Define volume for today only (other days zero):
#
def todayvol = if istoday then volume else 0;
#
# Calculate the P*V term for VWAP:
#
def pv = num * todayvol;
#
# Code for BarIncremental counter:
#
rec k = if k[1] == n then 1 else k[1] + 1;
#
# Code for VolIncremental volume sum:
#
rec volsum=if volsum[1]>v then volume else volsum[1]+volume;
#
# Code for VolIncremental price*volume:
#
rec pvsum =if volsum[1]>v then num*volume else pvsum[1] + num*volume;
#
# Now define the VolIncremental to display:
#
rec volinc=if volsum[1]==0 then num else if volsum[1]>v then pvsum[1]/volsum[1] else volinc[1];
#
# Now the final VWAP calculations:
#
rec calcVWAP = if type == 2 then TotalSum(pv) / TotalSum(todayvol) else if type == 1 then sum(num*volume, n) / sum(volume, n) else if type==3 then volinc else if type==0 and k == n then sum(num*volume, n) / sum(volume, n) else calcvwap[1];
#
# Define the plot:
#
plot VWAPALOOZA = calcvwap;
def vwapSD = StDev(CalcVWAP,DPeriod);
plot r1 = VWAPALOOZA+VWAPStdev1*vwapSD;
plot s1 = VWAPALOOZA-vwapStdev1*vwapSD;
plot r2 = VWAPALOOZA+VWAPStdev2*vwapSD;
plot s2 = VWAPALOOZA-VWAPStdev2*vwapSD;
plot r3 = VWAPALOOZA+VWAPStdev3*vwapSD;
plot s3 = VWAPALOOZA-VWAPStdev3*vwapSD;

r1.setDefaultColor(color.orange);
r2.setDefaultColor(color.pink);
r3.setDefaultColor(color.cyan);
s1.setDefaultColor(color.orange);
s2.setDefaultColor(color.pink);
s3.setDefaultColor(color.cyan);

r1.SetStyle(curve.SHORT_DASH);
r2.SetStyle(curve.SHORT_DASH);
r3.SetStyle(curve.SHORT_DASH);
s1.SetStyle(curve.SHORT_DASH);
s2.SetStyle(curve.SHORT_DASH);
s3.SetStyle(curve.SHORT_DASH);

Def HMax = Max(High,Low);
Def LMin = Min(High,Low);
addCloud(LMin,VWAPALOOZA,Color.Lime,Color.Black);
addCloud(HMax,VWAPALOOZA,Color.Black,Color.Pink);

#
# Formatting:
#
VWAPALOOZA.setdefaultcolor(color.white);
VWAPALOOZA.setstyle(curve.long_dash);
VWAPALOOZA.setlineweight(3);
 
@tradebyday summed up the possible causes, for the average person though its normally the fact they have extended hours enabled/disabled and that will make the difference, another possibility is if you are paying for data make sure you are getting the all the latest quotes from the exchanges, if you are only paying for a few exchanges you may possibly be missing SOME of the data needed to calculate vwap correctly.

@murkr In the past ive had IB and TOS and they always had the same VWAP, however i was also paying for the exchange data on IB, you may possibly be missing exchange data or have the extended hours different.
 

Similar threads

Not the exact question you're looking for?

Start a new thread and receive assistance from our community.

87k+ Posts
392 Online
Create Post

Similar threads

Similar threads

The Market Trading Game Changer

Join 2,500+ subscribers inside the useThinkScript VIP Membership Club
  • Exclusive indicators
  • Proven strategies & setups
  • Private Discord community
  • ‘Buy The Dip’ signal alerts
  • Exclusive members-only content
  • Add-ons and resources
  • 1 full year of unlimited support

Frequently Asked Questions

What is useThinkScript?

useThinkScript is the #1 community of stock market investors using indicators and other tools to power their trading strategies. Traders of all skill levels use our forums to learn about scripting and indicators, help each other, and discover new ways to gain an edge in the markets.

How do I get started?

We get it. Our forum can be intimidating, if not overwhelming. With thousands of topics, tens of thousands of posts, our community has created an incredibly deep knowledge base for stock traders. No one can ever exhaust every resource provided on our site.

If you are new, or just looking for guidance, here are some helpful links to get you started.

What are the benefits of VIP Membership?
VIP members get exclusive access to these proven and tested premium indicators: Buy the Dip, Advanced Market Moves 2.0, Take Profit, and Volatility Trading Range. In addition, VIP members get access to over 50 VIP-only custom indicators, add-ons, and strategies, private VIP-only forums, private Discord channel to discuss trades and strategies in real-time, customer support, trade alerts, and much more. Learn all about VIP membership here.
How can I access the premium indicators?
To access the premium indicators, which are plug and play ready, sign up for VIP membership here.
Back
Top