somebritishbloke
New member
Hello,
I was hoping that someone could help by coding the following, as I've been trying for the life of me and just can't seem to figure it out.
I was hoping that someone could help by coding the following, as I've been trying for the life of me and just can't seem to figure it out.
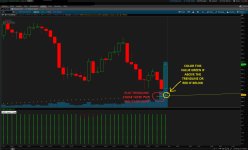
- As shown in the attached example image (with a manually drawn trendline), plot a trendline connecting the value of VWAP 2 and 3 periods ago. Then, color the value of VWAP during the current open bar so that if it is above the trendline, it is green, or if it is below, it is red.
- I hope this isn't a stupid idea or a waste of anyone's time, but my amateur eyes seem to spot a bit of a scalpable trading pattern as a trendline between two VWAP values can be used to see if the next close is above or below the trend, which is then a trading opportunity. In other words, it is a way of capturing increases/decreases in the VWAP curve.