
Author Message :
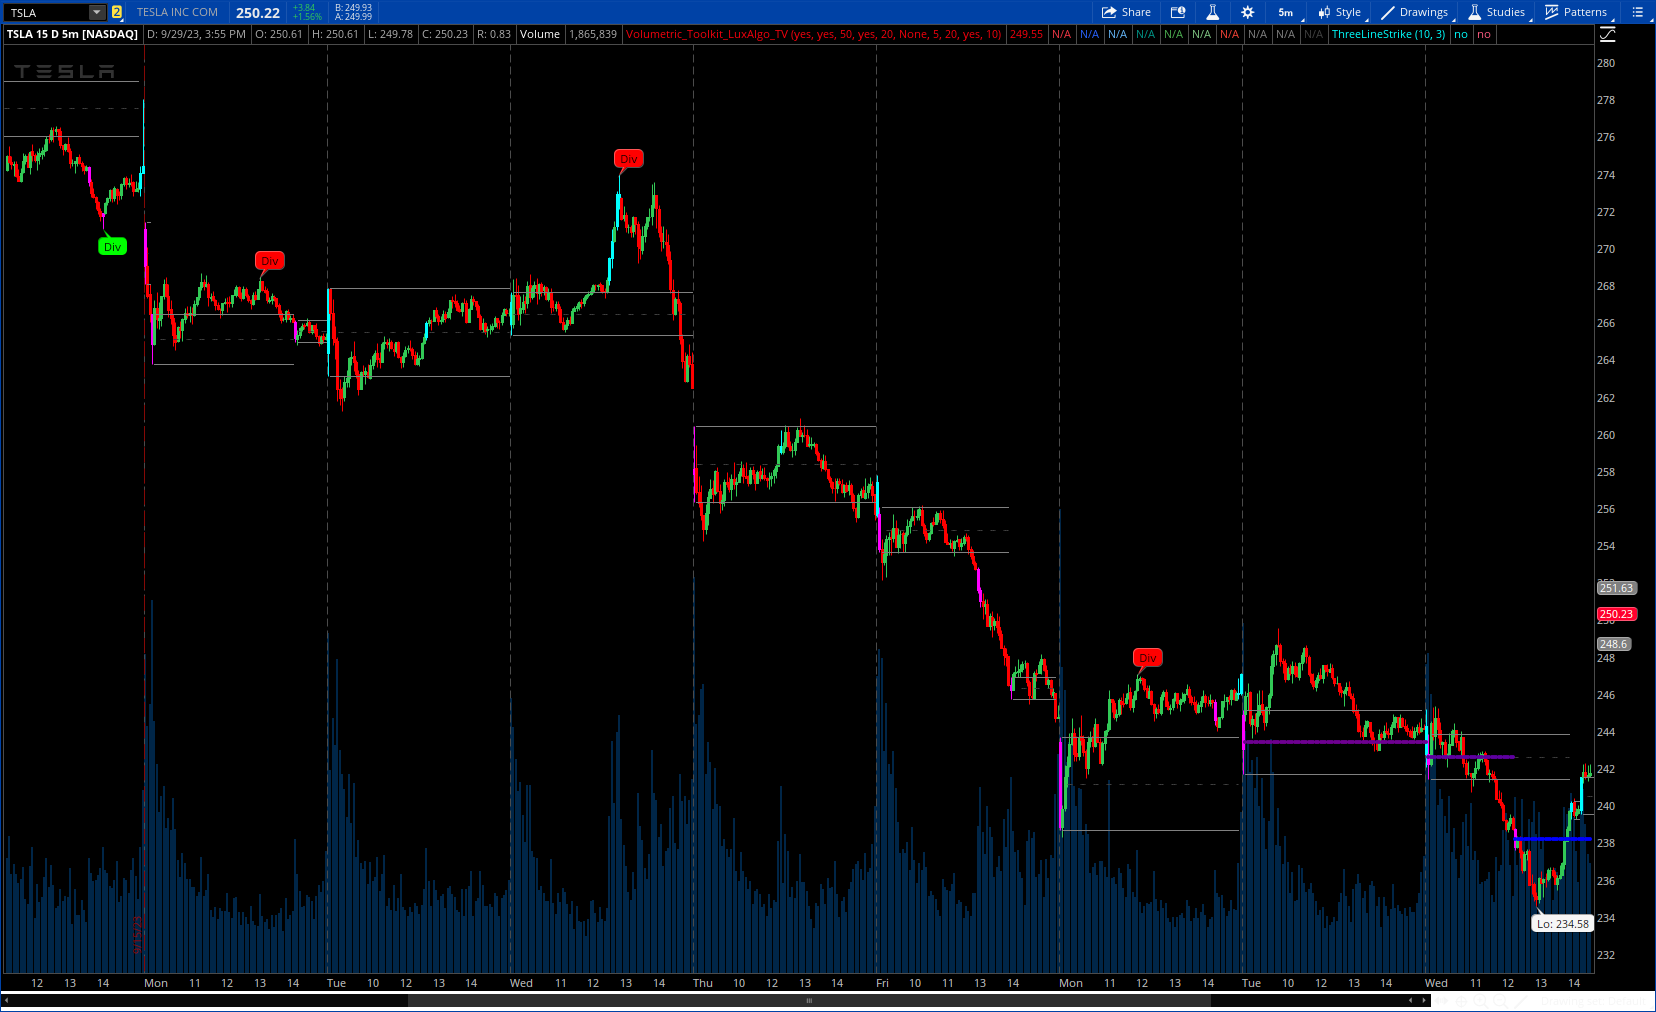
The Volumetric Toolkit is a complete and comprehensive set of tools that display price action-related analysis methods from volume data.
A total of 4 features are included within the toolkit. Symbols that do not include volume data will not be supported by the script.
More Details : https://www.tradingview.com/v/iSs4eqFJ/
CODE:
CSS:
# https://www.tradingview.com/v/iSs4eqFJ/
#// This work is licensed under a Attribution-NonCommercial-ShareAlike 4.0 International
#// © LuxAlgo
#indicator("Volumetric Toolkit [LuxAlgo]", "LuxAlgo - Volumetric Toolkit",

# Converted and mod by Sam4Cok@Samer800    - 09/2023

input ShowVolumetricInterestLine = yes;
input ShowRangesOfInterest = yes;    # 'Show Ranges Of Interest'
input roiLength = 50;                # 'ROI Length'
input showImpulseCandles = yes;      # 'Show Impulses'
input ImpulsesLength = 20;           # 'Impulses Length'
input LevelOfInterestDisplay = {"Highest And Lowest", "Fibonacci Levels",
                                 "Both",Default "None"};
input NoOfLevelsToShow = 5;          # 'No Of Levels To Show'
input loiLength = 20;                # 'Levels Of Interest Length'
input showDivergences = yes;         # 'Show Divergences'
input DivergenceLength = 10;         # 'Divergence Length'

def na = Double.NaN;
def last = IsNaN(close);
#//Main Variables
def n = AbsValue(BarNumber());
def v = volume;
def HiLo; Def Fibo;
Switch (LevelOfInterestDisplay) {
Case "Highest And Lowest" :
    HiLo = yes;
    Fibo = no;
Case "Fibonacci Levels" :
    HiLo = no;
    Fibo = yes;
Case "Both" :
    HiLo = yes;
    Fibo = yes;
Default:
    HiLo = no;
    Fibo = no;
}
DefineGlobalColor("up", CreateColor(41, 98, 255));
DefineGlobalColor("dn", CreateColor(242, 54, 69));
DefineGlobalColor("md", CreateColor(118, 28, 202));
DefineGlobalColor("786", CreateColor(244, 67, 54));
DefineGlobalColor("618", CreateColor(129, 199, 132));
DefineGlobalColor("500", CreateColor(76, 175, 80));
DefineGlobalColor("382", CreateColor(0, 150, 136));
DefineGlobalColor("236", CreateColor(100, 181, 246));
script FindPivots {
    input dat = close; # default data or study being evaluated
    input HL  = 0;    # default high or low pivot designation, -1 low, +1 high
    input lbL  = 5;    # default Pivot Lookback Left
    input lbR  = 1;    # default Pivot Lookback Right
    ##############
    def _nan;    # used for non-number returns
    def _BN;     # the current barnumber
    def _VStop;  # confirms that the lookforward period continues the pivot trend
    def _V;      # the Value at the actual pivot point
    def _pivotRange;
    ##############
    _BN  = BarNumber();
    _nan = Double.NaN;
    _pivotRange = lbL + lbL;
    _VStop = if !IsNaN(dat[_pivotRange]) and lbR > 0 and lbL > 0 then
                fold a = 1 to lbR + 1 with b=1 while b do
                    if HL > 0 then dat > GetValue(dat, -a) else dat < GetValue(dat, -a) else _nan;
    if (HL > 0) {
        _V = if _BN > lbL and dat == Highest(dat, lbL + 1) and _VStop
            then dat else _nan;
    } else {
        _V = if _BN > lbL and dat == Lowest(dat, lbL + 1) and _VStop
            then dat else _nan;
    }
    plot result = if !IsNaN(_V) and _VStop then _V else _nan;
}
#minimax(ds, p, min, max) =>  // normalize to price
script minimax {
    input ds = hl2;
    input hiVal = high;
    input LoVal = low;
    input min = 0;
    input max = 100;
    def hi = hiVal;
    def lo = LoVal;
    def minimax = (max - min) * (ds - lo) / (hi - lo) + min;
    plot out = minimax;
}
def loiPhv = findpivots(v, 1, loiLength, loiLength);
def loi_phv = !IsNaN(loiPhv);

def avg = if loi_phv then hl2 else avg[1];
def avgCnt = if avg - avg[1] then avgCnt[1] + 1 else avgCnt[1];
def hiAvgCnt = HighestAll(avgCnt);
def Avgcond0 = avgCnt == (hiAvgCnt - NoOfLevelsToShow);
def plotCond = (Avgcond0 and !Avgcond0[1]);
def avgBar0 = if plotCond then n else avgBar0[1];
def barCond0 = n > HighestAll(avgBar0) and !last;
def avgLine0 = if barCond0 then avg else na;
def avgHi0 = HighestAll(if avgLine0 then avgLine0 else 0);
def avgLo0 = LowestAll(if avgLine0 then avgLine0 else 1000000);

def col0 = minimax(avg, avgHi0, avgLo0, 0, 100);
def colVal0 = (if col0 > 100 then 100 else if col0 < 0 then 0 else col0) * 2.55;
def rngDif = if Fibo then (avgHi0 - avgLo0) else na;
def fibUp = if plotCond and colVal0 > 50 then 1 else 0;
def fib1;
def fib2;
def fib3;
def fib4;
def fib5;

if fibUp {
    fib1 = avgHi0 - rngDif * 0.236;
    fib2 = avgHi0 - rngDif * 0.382;
    fib3 = avgHi0 - rngDif * 0.500;
    fib4 = avgHi0 - rngDif * 0.618;
    fib5 = avgHi0 - rngDif * 0.786;
} else {
    fib1 = avgLo0 + rngDif * 0.236;
    fib2 = avgLo0 + rngDif * 0.382;
    fib3 = avgLo0 + rngDif * 0.500;
    fib4 = avgLo0 + rngDif * 0.618;
    fib5 = avgLo0 + rngDif * 0.786;
}

plot plotAvgLine = if ShowVolumetricInterestLine and avgLine0 then avgLine0 else na;
plot avgUp = if !HiLo then na else if barCond0 then avgHi0 else na;
plot AvgDn = if !HiLo then na else if barCond0 then avgLo0 else na;
plot AvgMd1 = if barCond0 then fib1 else na;
plot AvgMd2 = if barCond0 then fib2 else na;
plot AvgMd3 = if barCond0 then fib3 else na;
plot AvgMd4 = if barCond0 then fib4 else na;
plot AvgMd5 = if barCond0 then fib5 else na;

plotAvgLine.AssignValueColor(CreateColor(colVal0, 0, 255 - colVal0));
plotAvgLine.SetStyle(Curve.POINTS);
avgUp.SetDefaultColor(GlobalColor("dn"));
AvgDn.SetDefaultColor(GlobalColor("up"));
AvgMd1.SetDefaultColor(GlobalColor("236"));
AvgMd2.SetDefaultColor(GlobalColor("382"));
AvgMd3.SetDefaultColor(GlobalColor("500"));
AvgMd4.SetDefaultColor(GlobalColor("618"));
AvgMd5.SetDefaultColor(GlobalColor("786"));
AvgMd1.SetPaintingStrategy(PaintingStrategy.DASHES);
AvgMd2.SetPaintingStrategy(PaintingStrategy.DASHES);
AvgMd3.SetPaintingStrategy(PaintingStrategy.DASHES);
AvgMd4.SetPaintingStrategy(PaintingStrategy.DASHES);
AvgMd5.SetPaintingStrategy(PaintingStrategy.DASHES);
#GlobalColor("up"
#//Ranges Of Interest

def rhv = Highest(v, roiLength);
def rhvCon = rhv == v;
def roi_avg   = if ShowRangesOfInterest and rhvCon then hl2 else roi_avg[1];
def roi_upper = if ShowRangesOfInterest and rhvCon then high else roi_upper[1];
def roi_lower = if ShowRangesOfInterest and rhvCon then low else roi_lower[1];

#//Impulses

def imp_upv = Highest(v, ImpulsesLength);
def imp_up = Highest(high, ImpulsesLength);
def imp_dn = Lowest(low, ImpulsesLength);

def bull_imp = imp_upv > imp_upv[1] and imp_up > imp_up[1] and showImpulseCandles;
def bear_imp = imp_upv > imp_upv[1] and imp_dn < imp_dn[1] and showImpulseCandles;

#/Volume Divergences

def ph  = FindPivots(high, 1, DivergenceLength, DivergenceLength);
def pl  = FindPivots(low, -1, DivergenceLength, DivergenceLength);
def phv = FindPivots(v,   1, DivergenceLength, DivergenceLength);
def phvCond = !IsNaN(phv) and showDivergences;
def phv_y1;
def ph_y1;
def pl_y1;
#def x1;

def BearD;
def BullD;
if phvCond {
    BearD = if phv < phv_y1[1] and high > ph_y1[1] and !IsNaN(ph) then ph_y1[1] else na;
    BullD = if phv < phv_y1[1] and low < pl_y1[1] and !IsNaN(pl) then pl_y1[1] else na;
    phv_y1 = phv;
    ph_y1  = high;
    pl_y1  = low;
#    x1     = n - divLength;
} else {
    BearD = na;
    BullD = na;
    phv_y1 = phv_y1[1];
    ph_y1  = ph_y1[1];
    pl_y1  = pl_y1[1];
#    x1     = x1[1];
}
#/Plots
#//ROI
AddChartBubble(BearD, high, "Div", Color.RED);
AddChartBubble(BullD, low, "Div", Color.GREEN, no);

plot Upper = if roi_upper and !rhvCon then roi_upper else na;#, 'Upper'
plot Lower = if roi_lower and !rhvCon then roi_lower else na;#, 'Lower'
plot UpLo2 = if roi_avg and !rhvCon then roi_avg else na;
Upper.SetDefaultColor(Color.GRAY);
Lower.SetDefaultColor(Color.GRAY);
UpLo2.SetDefaultColor(Color.DARK_GRAY);
UpLo2.SetStyle(Curve.SHORT_DASH);

AssignPriceColor(if bull_imp then Color.CYAN else
                 if bear_imp then Color.MAGENTA else Color.CURRENT);


#-- END of CODE