
Author Message :
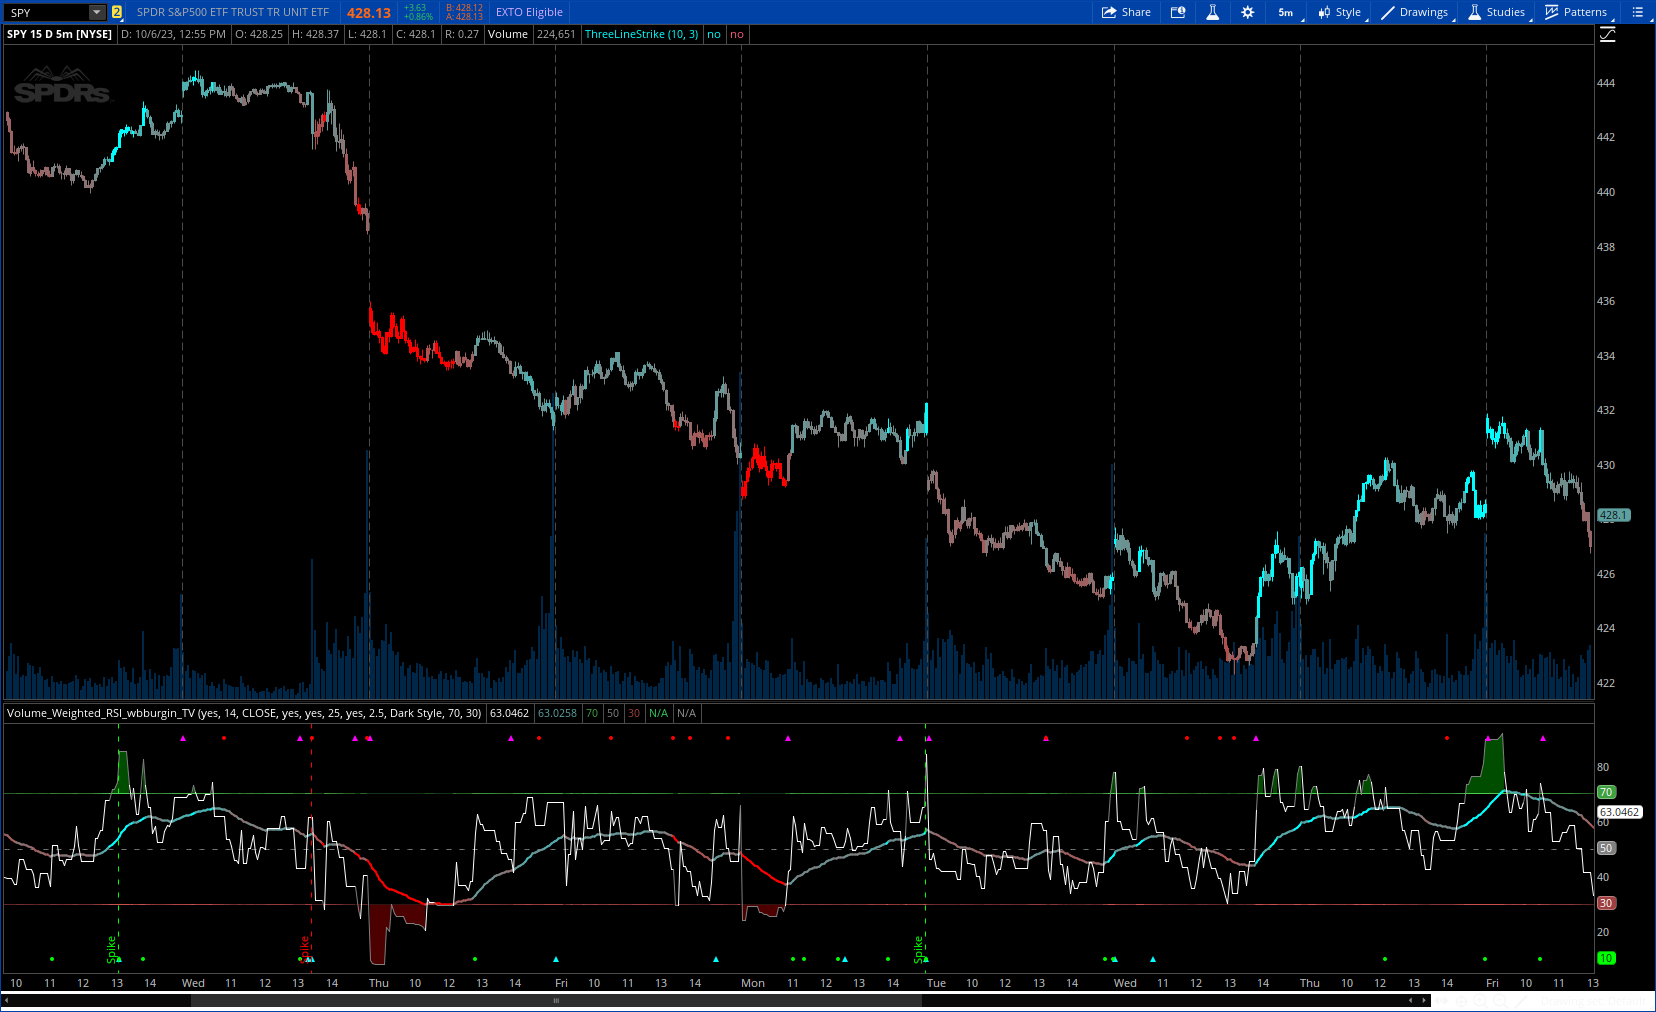
The Volume-Weighted RSI takes a new approach to the traditional calculation of the RSI in using a price::volume calculation. As some traders consider volume to be a leading indicator for price, the volume-weighted RSI can come in handy if you want to visualize volume easier.
More Details : https://www.tradingview.com/v/cM6CWwGG/
CODE:
CSS:
# https://www.tradingview.com/v/cM6CWwGG/
#/ This source code is subject to the terms of the Mozilla Public License 2.0
#// © wbburgin
#indicator("Volume-Weighted RSI [wbburgin]",overlay=false)
# converted by Sam4Cok@Samer800    - 10 / 2023
declare lower;

input barColors = yes;             # "Bar Colors"
input length = 14;        # "Length"
input src = close;        # "Source"
input showVolumeWeightedRsi = yes; # "Plot Volume-weighted RSI"
input ShowSignalLine = yes;        # "Use Signal"
input SignalLineLength = 25;       # " | Signal Length"
input showAbnormalActivity = yes;  # "Plot Abnormal Activity"
input Multi = 2.5;                 # " | SD Multiple"
input stylesheet = {default "Dark Style", "Light Style"};
input overbought_level = 70;       # 'Overbought'
input oversold_level = 30;         # 'Oversold'

def na = Double.NaN;
def last = isNaN(Close);
def plotBase = showVolumeWeightedRsi;
def useabn = showAbnormalActivity;
# //  CORE LOGIC
#minimax(ds, p, min, max) =>
script minimax {
    input ds = close;
    input p  = 10;
    input min = 0;
    input max = 100;
    def hi = max;#Highest(ds, p);
    def lo = min;#Lowest(ds, p);
    def minimax = (max - min) * (ds - lo) / (hi - lo) + min;
    plot out = minimax;
}
#pricevolume_rsi(x, y) =>
script pricevolume_rsi {
    input x = close;
    input y = 14;
    def u_x = Max(x - x[1], 0) * Max(volume - volume[1], 0);
    def d_x = Max(x[1] - x, 0) * Max(volume[1] - volume, 0);
    def u = if u_x > 0 then Sqrt(u_x) else - Sqrt(u_x);
    def d = if d_x > 0 then Sqrt(d_x) else - Sqrt(d_x);
    def rs = WildersAverage(u, y) / WildersAverage(d, y);
    def res = 100 - 100 / (1 + rs);
    plot out = res;
}
def pvrRSI1 = pricevolume_rsi(src, length);
def pvrsi = Average(pvrRSI1, 1);
def pvrsi_ma = WildersAverage(pvrsi, SignalLineLength);

#// Abnormal Volume Calculations
def SignSrc = Sign(src - src[1]);
def volDif = AbsValue(volume - volume[1]);
def obv = Sum(SignSrc * volume, 500);
def volume_difference = volDif / volume[1];
def avgVolDif = Average(volume_difference, length);
def sDevVolDif = StDev(volume_difference, length) * Multi;
def abnormal_volume = volume_difference >= (avgVolDif + sDevVolDif);
def abv_pos = abnormal_volume and obv > obv[1];
def abv_neg = abnormal_volume and obv < obv[1];
def vd_placement = if abv_neg then 90 else if abv_pos then 10 else na;

#// Abnormal Price Calculations
def SignVol = Sign(volume - volume[1]);
def srcDif = AbsValue(src - src[1]);
def obp = Sum(SignVol * src, 500);
def price_difference = srcDif / src[1];
def avgSrcDif = Average(price_difference, length);
def sDevSrcDif = StDev(price_difference, length) * Multi;
def abnormal_price =  price_difference >= (avgSrcDif + sDevSrcDif);
def abp_pos = abnormal_price and obp > obp[1];
def abp_neg = abnormal_price and obp < obp[1];
def pd_placement = if abp_neg then 90 else if abp_pos then 10 else na;

# // STYLE & DESIGN
# // RSI Design  ---------- |
def dark = stylesheet == stylesheet."Dark Style";
def colCond = pvrsi > overbought_level or pvrsi < oversold_level;
plot plot_rsi = if plotBase then pvrsi else na;    # "Volume RSI"
plot_rsi.AssignValueColor(if colCond then Color.GRAY else
                          if dark then Color.WHITE else Color.BLACK);

#// Adding gradients on top of the PVRSI plot ---------- |
def pvrsi_up = if pvrsi > 50 then pvrsi else na;
def pvrsi_dn = if pvrsi < 50 then pvrsi else na;

def pvrsi_up_color = minimax(pvrsi, 50, 100);
def pvrsi_dn_color = minimax(pvrsi,  0, 50);

#// Signal and Bar Color ---------- |
def minmaxBar = minimax(pvrsi, oversold_level, overbought_level);
def barcolor = (if minmaxBar > overbought_level then 100 else
                if minmaxBar < oversold_level then 0 else minmaxBar) * 2.55;

plot Signal = if ShowSignalLine then pvrsi_ma else na;#, "Signal"
Signal.SetLineWeight(2);
Signal.AssignValueColor(CreateColor(255 - barcolor, barcolor, barcolor));

AssignPriceColor(if !barcolors then Color.CURRENT else CreateColor(255 - barcolor, barcolor, barcolor));


#// Overbought / Oversold  ---------- |
def obColor = (if minmaxBar > overbought_level then 80 else
               if minmaxBar < oversold_level then 20 else minmaxBar) ;

plot plot_up = if last then na else overbought_level;
plot plot_avg = if last then na else 50;
plot plot_dn = if last then na else oversold_level;

plot_avg.SetStyle(Curve.SHORT_DASH);
plot_avg.SetDefaultColor(Color.GRAY);
plot_Up.AssignValueColor(CreateColor(obColor , obColor * 2.55, obColor));
plot_Dn.AssignValueColor(CreateColor(obColor * 2.55, obColor, obColor));

AddCloud(if pvrsi > overbought_level then plot_rsi else na, plot_up, Color.GREEN);
AddCloud(if pvrsi < oversold_level then plot_dn else na, plot_rsi, Color.RED);

#/ Abnormal Activity  ---------- |

#pvs = switch
AddVerticalLine(useabn and abv_pos and abp_pos, "Spike", Color.GREEN);
AddVerticalLine(useabn and abv_neg and abp_pos, "Spike", Color.RED);

plot AbVol = if useabn then vd_placement else na;#, title="Abnormal Volume"
plot AbPri = if useabn then pd_placement else na;#, title="Abnormal Price"

AbVol.AssignValueColor(if obv < obv[1] then Color.RED else Color.GREEN);
AbPri.AssignValueColor(if obp < obp[1] then Color.MAGENTA else Color.CYAN);

AbVol.SetPaintingStrategy(PaintingStrategy.POINTS);
AbPri.SetPaintingStrategy(PaintingStrategy.TRIANGLES);

#-- END of CODE