

Volume-Trend Order Block Engine [BigBeluga]
Author states: Volume-Trend Order Block Engine [BigBeluga] is a powerful trading tool. It combines trend direction with volume-weighted Order Blocks (OB) to show you exactly where institutional buyers and sellers are active in real time.Instead of drawing basic support and resistance lines, this tool filters out market noise using a built-in Supertrend Engine. This ensures you only see order blocks that align with the main market trend. It also splits each block based on buy/sell volume, showing you who is in control.
Order blocks that tell you WHO was in control when they formed.
This is a ThinkScript conversion of BigBeluga's "Volume-Trend Order Block Engine" from TradingView
original script: https://www.tradingview.com/script/Hkkeb8d1-Volume-Trend-Order-Block-Engine-BigBeluga/
-- all credit for the concept goes to BigBeluga).
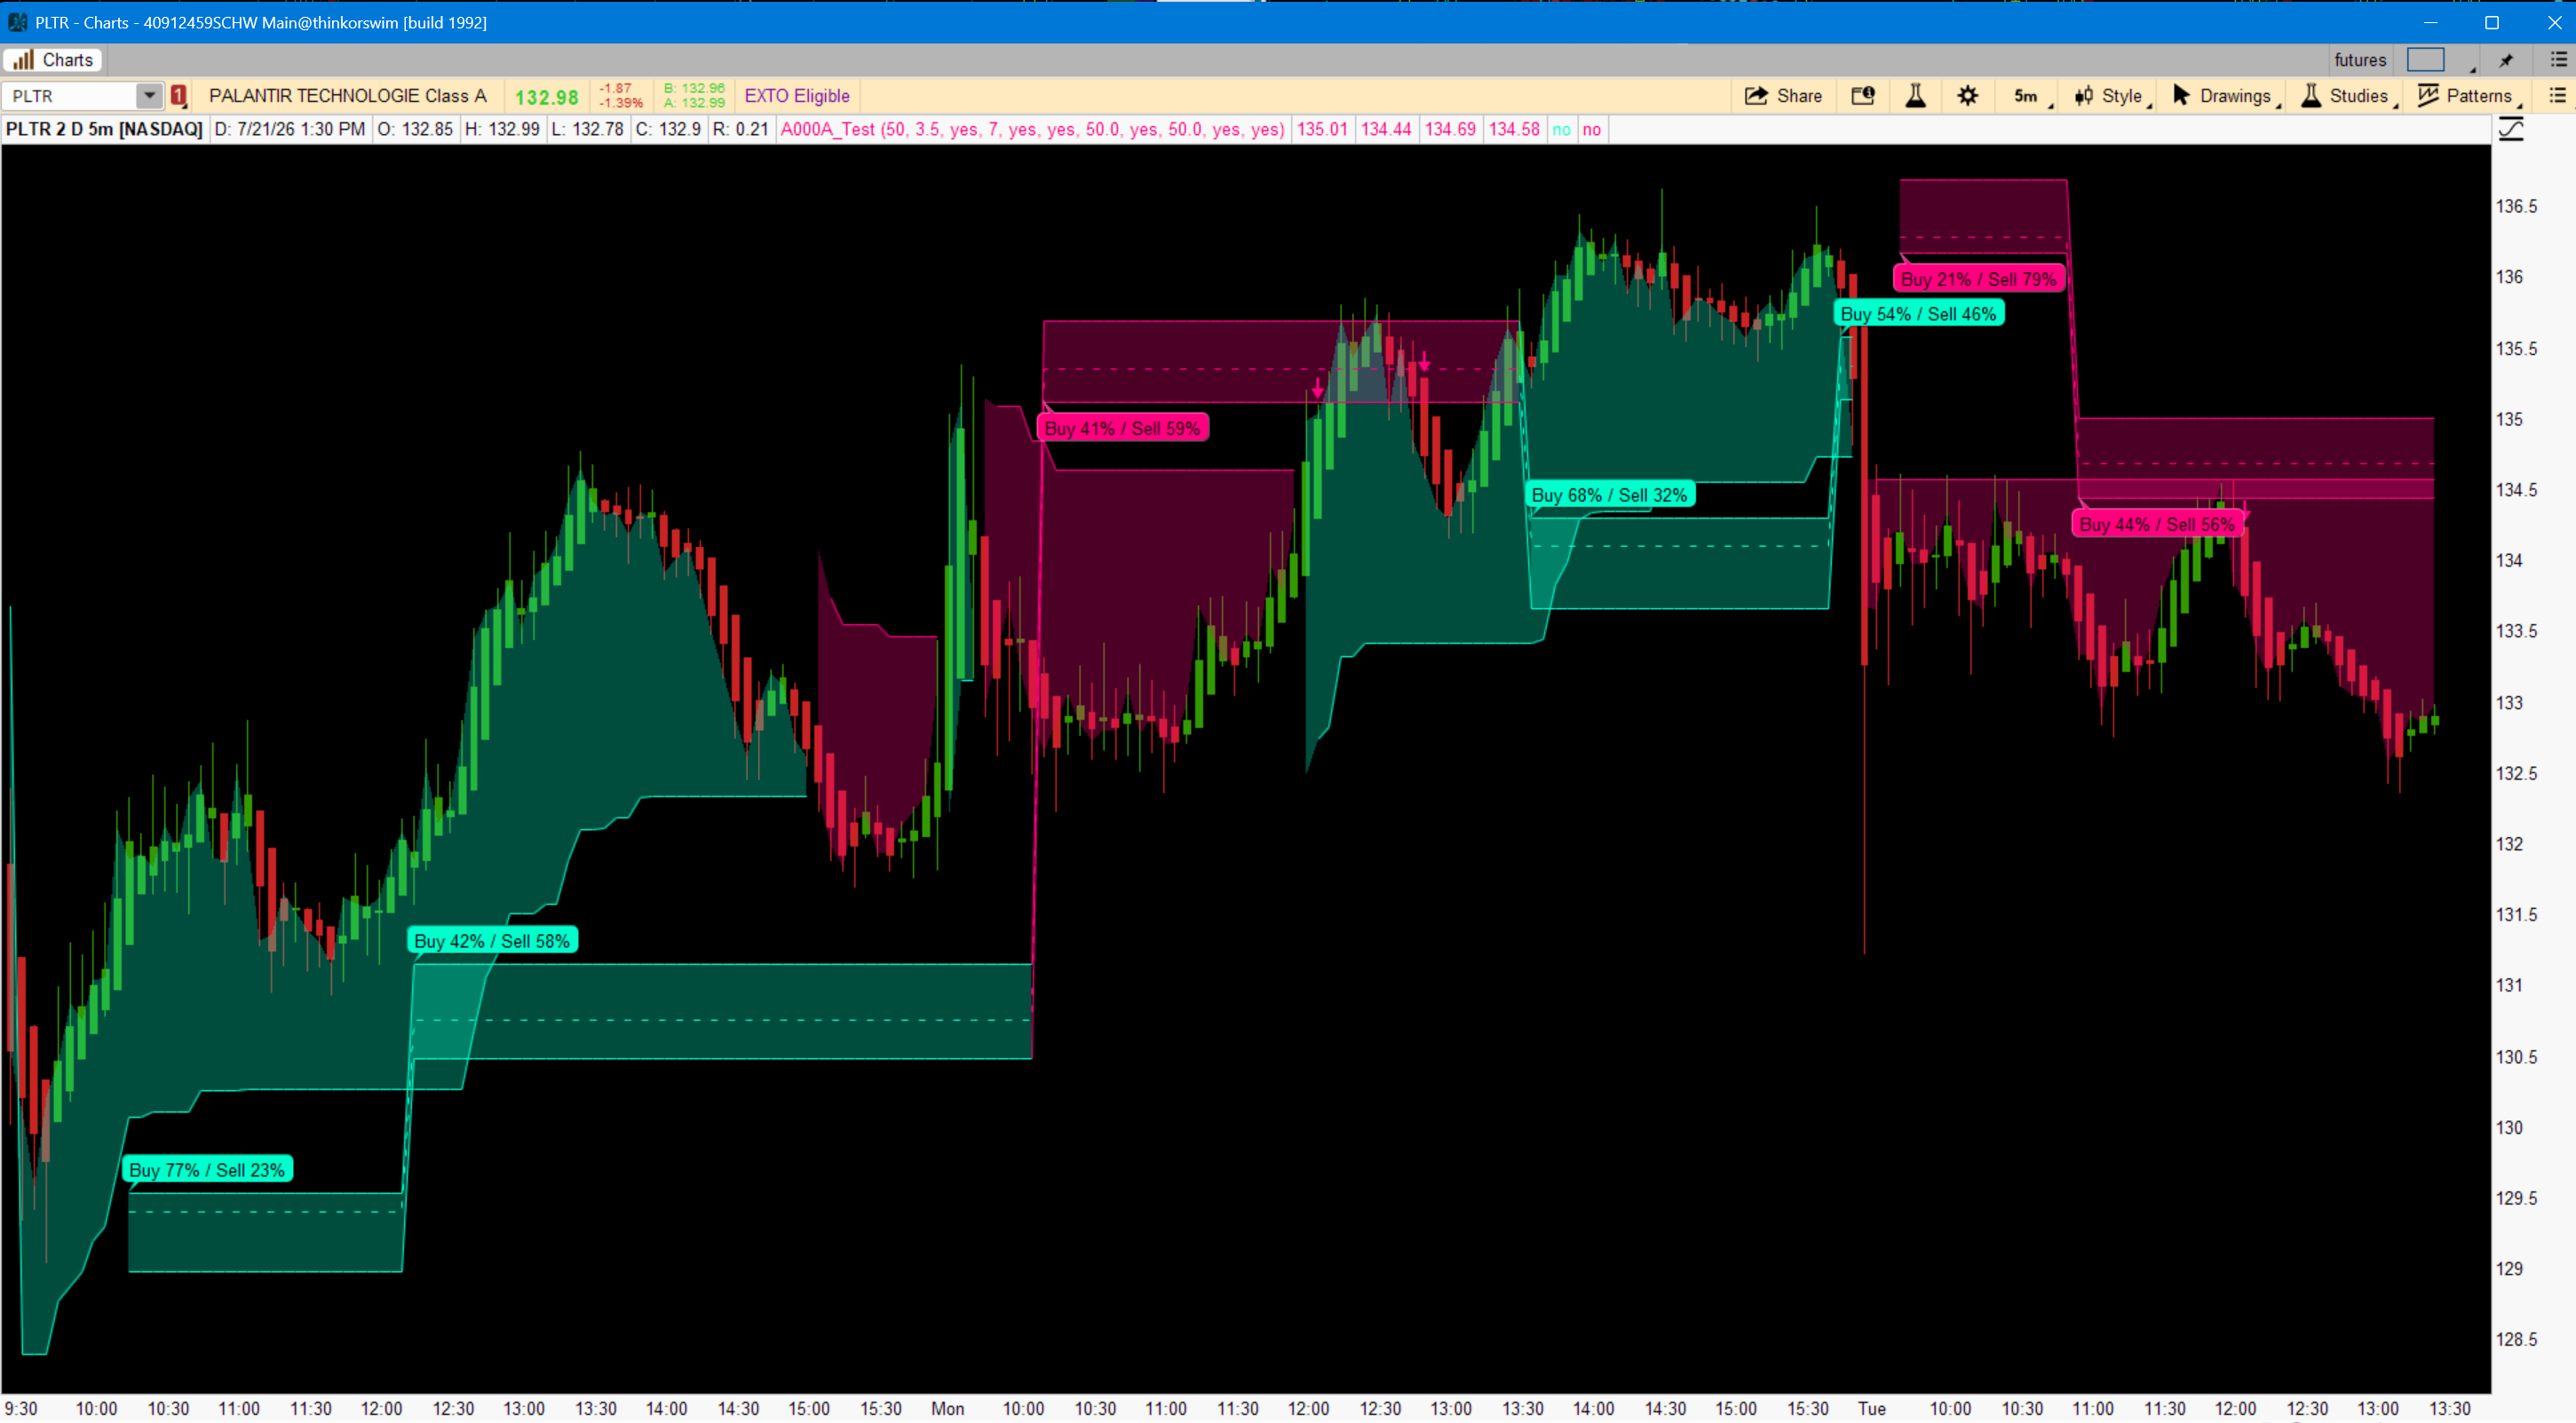
What it does
1. Trend Engine
A custom Supertrend runs underneath everything -- but instead of Wilder's ATR it uses a simple average of candle range (high minus low, 50 bars). That gives you the trend cloud and the colored trailing stop line.
2. Order Block Detection
When a swing low confirms during an uptrend (7 bars on each side), it draws a bullish order block off that pivot candle's body, sized one volatility unit deep. Swing highs in downtrends draw bearish blocks the same way.
3. Volume Split
Here's the part I like: the block is split into two zones based on the buy vs sell volume in the pivot window. Up-close candles count as buy volume, down-close as sell volume. If the window ran 70% buy volume, the buy zone is 70% of the box height, and a bubble prints the exact percentages at creation. So a bullish OB backed by 70% buying is a very different animal than one backed by 45%.
4. Retest Signals
Retest arrows fire when price lifts entirely off a bullish block (the LOW crosses above the block's top) or drops entirely through a bearish block's bottom -- filtered by a minimum Buy% or Sell% you set in the inputs. Default is 50%, crank it to 60-65% if you only want conviction blocks.
5. Block Management
Blocks that overlap the active one get skipped (kills box spam in chop), and a block dies automatically once a full candle prints beyond it.
Settings worth touching
pivotLen (7) -- pivot strength. Higher = fewer, more significant blocks. Note signals confirm pivotLen bars after the actual swing, that's inherent to pivot logic, same as the TradingView original.minBuyPct / minSellPct (50) -- the volume conviction filter for retest arrows.
deleteOnBreak (yes) -- turn off if you want broken blocks to stay live for retests.
stLength / stMult (50 / 3.5) -- the Supertrend engine. Colors are under Globals in the study settings since thinkscript has no color inputs.
Real-world observations
I've been running it on SOXL 15-min. The volume split ends up being the edge -- retests of high-Buy% blocks in an uptrend behave noticeably better than generic OB retests.Honest limitations vs the TradingView version
(thinkscript can't do drawing objects, so this uses a recursive state machine plus plots/clouds instead of boxes):- Only the ACTIVE order block shows. When a new block replaces an old one, the old one disappears instead of staying frozen on the chart. All the signal logic matches -- the original only ever computes off the active block anyway -- so this is cosmetic.
- Both zones shade at the same opacity. TV uses two-tone alpha. The dashed split line + bubble carry the ratio instead.
- Retest arrows can flicker on the live bar until it closes. No barstate.isconfirmed equivalent in a study. Completed bars match the original.
- Retest markers are arrows, not crosses. TOS has no cross plotshape.
Alerts
Alert() lines are included at the bottom, commented out, if you want sound on retests. Should work as a scan condition too if you strip it down to the BuyRetest/SellRetest plots.Enjoy, and if anyone spots a discrepancy against the TradingView original on the same chart, post the bar and I'll dig into it.
Code:
# ==============================================================================
# AI assisted and Ported over from Pinescript to Thinkscript by Strehsum 7/21/2026
# Original Code and Instructions:
# https://www.tradingview.com/script/Hkkeb8d1-Volume-Trend-Order-Block-Engine-BigBeluga/?utm_source=notification_email&utm_medium=email&utm_campaign=notification_pubscript_update
# ==============================================================================
# Volume-Trend Order Block Engine -- ThinkScript conversion, v2 (refined)
# Converted from Pine Script v6 "Volume-Trend Order Block Engine [BigBeluga]"
# Original (c) BigBeluga, licensed CC BY-NC-SA 4.0 -- personal/non-commercial use,
# attribution preserved. https://creativecommons.org/licenses/by-nc-sa/4.0/
#
# v2 refinements over v1:
#   * State machine now stores the OB's FAR edge (bull bottom / bear top),
#     frozen at creation -> break/invalidation levels are EXACT (v1 drifted
#     with the current volatility average).
#   * Near edge stored separately at creation -> all plotted edges, the split
#     price, and retest levels are exact; no stored-ATR variable needed.
#   * Instant-break check nested inside creation branches, replicating Pine's
#     create-then-delete-same-bar execution order.
#   * Creation events detected by re-evaluating the creation conditions
#     (deterministic duplicates of the state machine's own test), not by
#     value-change, so back-to-back boxes with identical edges still register.
#
# Remaining known deviations from Pine (see conversion notes):
#   * Only the ACTIVE order block renders; superseded boxes don't persist.
#   * Overlap suppression reconstructs the prior box's NEAR edge with the
#     current volatility SMA (forward-reference ban) -- affects only
#     borderline keep-vs-replace decisions, never plotted or signal levels.
#   * Cloud opacity fixed (no 75/85 two-tone); split line + bubble carry the
#     Buy/Sell ratio instead. No cross plotshape -> arrows.
#   * No barstate.isconfirmed equivalent: live-bar arrows can flicker until
#     the bar closes; completed bars match Pine exactly.
#   * Sign-encoded state assumes positive prices (bull OB bottom must be > 0).
# ==============================================================================

declare upper;

# ---------------------------- INPUTS ------------------------------------------
input stLength         = 50;    # Volatility SMA length: SMA of (high - low)
input stMult           = 3.5;   # Band multiplier
input showTrendCloud   = yes;   # Shade between close and the trend stop line
input pivotLen         = 7;     # Pivot strength (bars required left AND right)
input deleteOnBreak    = yes;   # Remove OB once price completely breaks it
input showBullRetest   = yes;   # Signals when low crosses above bull OB top
input minBuyPct        = 50.0;  # Min Buy% (pivot window) for bull retests
input showBearRetest   = yes;   # Signals when high crosses below bear OB bottom
input minSellPct       = 50.0;  # Min Sell% (pivot window) for bear retests
input showVolumeLabels = yes;   # Buy/Sell % bubble at OB creation
input showObCloud      = yes;   # Shade the order block zones (lines/split still plot)

# ThinkScript inputs have no color type -- edit these under Globals in settings
DefineGlobalColor("Bull", CreateColor(0, 255, 204));    # #00ffcc
DefineGlobalColor("Bear", CreateColor(255, 0, 127));    # #ff007f

# ---------------------------- CUSTOM SUPERTREND -------------------------------
# Pine uses sma(high - low, len) as its volatility proxy, not Wilder ATR.
# Pine's read-then-mutate (":=" with nz(band[1])) collapses into a single
# recursive def: band[1] here IS the final prior-bar value, same as Pine.
def src       = hl2;
def customATR = Average(high - low, stLength);
def upBasic   = src + stMult * customATR;
def dnBasic   = src - stMult * customATR;

def lowerBand = if IsNaN(customATR) then Double.NaN
                else if IsNaN(lowerBand[1]) then dnBasic
                else if dnBasic > lowerBand[1] or close[1] < lowerBand[1] then dnBasic
                else lowerBand[1];

def upperBand = if IsNaN(customATR) then Double.NaN
                else if IsNaN(upperBand[1]) then upBasic
                else if upBasic < upperBand[1] or close[1] > upperBand[1] then upBasic
                else upperBand[1];

# Pine tests prevSuperTrend == prevUpperBand as a float-equality proxy for
# "prior trend was -1"; branching on trend[1] directly is exactly equivalent
# (trend_stop is ASSIGNED from the bands) and avoids float-compare fragility.
def trend = CompoundValue(1,
    if IsNaN(customATR[1]) then 1
    else if trend[1] == -1 then (if close > upperBand then 1 else -1)
    else                        (if close < lowerBand then -1 else 1),
    1);

# NOTE: thinkScript identifiers are case-insensitive, so this cannot be named
# "trendStop" -- it would collide with "plot TrendStop" below.
def stopLevel = if trend == 1 then lowerBand else upperBand;

# ---------------------------- PIVOT DETECTION ---------------------------------
# ta.pivotlow(low, n, n) confirms n bars late; Pine's p_idx = bar_index - n
# becomes simply the offset [pivotLen]. The equality-vs-Lowest test encodes
# "no bar in the 2n+1 window is strictly lower" -- the operative Pine
# semantics. Residual: exact-tie plateaus may register differently.
def isPivL = !IsNaN(low[2 * pivotLen])  and low[pivotLen]  == Lowest(low,  2 * pivotLen + 1);
def isPivH = !IsNaN(high[2 * pivotLen]) and high[pivotLen] == Highest(high, 2 * pivotLen + 1);

# ---------------------------- PIVOT-WINDOW VOLUME RATIO -----------------------
# Pine loops i = 0..pivot_len (inclusive) at the confirmation bar; fold's "to"
# is EXCLUSIVE, hence pivotLen + 1. Every bar lands in exactly one bucket, so
# total volume is a plain Sum. Pine evaluates this only inside the creation
# branch; we evaluate every bar and freeze at creation -- identical stored
# values, since the expression is pure.
def buyVolWin = fold i = 0 to pivotLen + 1 with acc = 0 do
    acc + (if GetValue(close, i) >= GetValue(open, i) then GetValue(volume, i) else 0);
def totVolWin = Sum(volume, pivotLen + 1);
def buyPct    = if totVolWin > 0 then buyVolWin / totVolWin else 0.5;

# ---------------------------- ORDER BLOCK STATE MACHINE -----------------------
# Candidate anchors, read from the pivot bar itself:
#   Bull OB: top = min(open, close) of the pivot-low bar,  bottom = top - vol
#   Bear OB: bottom = max(open, close) of the pivot-high bar, top = bottom + vol
def bullRefC = Min(open[pivotLen], close[pivotLen]);
def bearRefC = Max(open[pivotLen], close[pivotLen]);

# ThinkScript forbids forward references, so mutually-recursive state (top,
# bottom, direction) cannot be separate variables. The whole state is packed
# into ONE signed recursive value holding the FAR edge, frozen at creation:
#   +price -> bullish OB active, value  = its BOTTOM (exact, creation-time)
#   -price -> bearish OB active, |value| = its TOP   (exact, creation-time)
#    0     -> no active OB
# Storing the FAR edge makes the break test exact (it compares against the
# frozen value directly). The overlap test must reconstruct the prior box's
# NEAR edge as far -/+ current customATR -- the one remaining approximation,
# confined to borderline keep-vs-replace decisions.
# The instant-break nesting inside each creation branch replicates Pine's
# execution order: creation block runs first, deletion block runs after and
# can kill a just-created box on the same bar.
def farState = CompoundValue(1,
    if trend == 1 and isPivL and
       ( farState[1] == 0
         or (bullRefC - customATR) > (if farState[1] > 0 then farState[1] + customATR else -farState[1])
         or  bullRefC              < (if farState[1] > 0 then farState[1] else -farState[1] - customATR) )
    then (if deleteOnBreak and high < bullRefC - customATR then 0 else bullRefC - customATR)
    else if trend == -1 and isPivH and
       ( farState[1] == 0
         or  bearRefC              > (if farState[1] > 0 then farState[1] + customATR else -farState[1])
         or (bearRefC + customATR) < (if farState[1] > 0 then farState[1] else -farState[1] - customATR) )
    then (if deleteOnBreak and low > bearRefC + customATR then 0 else -(bearRefC + customATR))
    else if deleteOnBreak and farState[1] > 0 and high < farState[1] then 0
    else if deleteOnBreak and farState[1] < 0 and low > -farState[1] then 0
    else farState[1],
    0);

# Creation events: deterministic duplicates of the state machine's own tests
# (same inputs -> same result every bar). Detecting creation this way, rather
# than by farState value-change, still fires when consecutive boxes share an
# identical far edge.
def createBullEv = trend == 1 and isPivL and
    ( farState[1] == 0
      or (bullRefC - customATR) > (if farState[1] > 0 then farState[1] + customATR else -farState[1])
      or  bullRefC              < (if farState[1] > 0 then farState[1] else -farState[1] - customATR) );
def createBearEv = trend == -1 and isPivH and
    ( farState[1] == 0
      or  bearRefC              > (if farState[1] > 0 then farState[1] + customATR else -farState[1])
      or (bearRefC + customATR) < (if farState[1] > 0 then farState[1] else -farState[1] - customATR) );

def obDir = if farState > 0 then 1 else if farState < 0 then -1 else 0;
# obDir != 0 excludes the created-and-instantly-broken case (Pine deletes the
# box the same bar; we never surface it).
def obCreated = (createBullEv or createBearEv) and obDir != 0;

# Near edge (bull TOP / bear BOTTOM), frozen exactly at creation.
def obNear = CompoundValue(1,
    if obCreated then (if createBullEv then bullRefC else bearRefC)
    else if obDir == 0 then Double.NaN
    else obNear[1],
    Double.NaN);

# Pivot-window Buy%, frozen at creation (persists after deletion, as Pine's
# active_buy_ratio does; retests are gated on an active box anyway).
def obBuyPct = CompoundValue(1, if obCreated then buyPct else obBuyPct[1], 0.5);

# Exact box geometry: both edges are frozen creation-time values.
def activeTop  = if obDir == 1 then obNear   else if obDir == -1 then -farState else Double.NaN;
def activeBot  = if obDir == 1 then farState else if obDir == -1 then obNear    else Double.NaN;
def splitPrice = if obDir == 0 then Double.NaN else activeBot + (activeTop - activeBot) * obBuyPct;

# ---------------------------- ORDER BLOCK PLOTS -------------------------------
plot ObTop = activeTop;
plot ObBot = activeBot;
plot ObSplit = splitPrice;

ObTop.AssignValueColor(if obDir == 1 then GlobalColor("Bull") else GlobalColor("Bear"));
ObBot.AssignValueColor(if obDir == 1 then GlobalColor("Bull") else GlobalColor("Bear"));
ObSplit.AssignValueColor(if obDir == 1 then GlobalColor("Bull") else GlobalColor("Bear"));
ObSplit.SetStyle(Curve.SHORT_DASH);
ObTop.HideBubble();
ObBot.HideBubble();
ObSplit.HideBubble();

# Two-zone shading (sell zone above the split, buy zone below), masked by
# direction so bull and bear boxes take their own colors.
# AddCloud cannot take recursive-variable expressions inline in its arguments,
# so every cloud series is hoisted into a plain def first.
def bullBoxTop   = if showObCloud and obDir == 1  then activeTop  else Double.NaN;
def bullBoxSplit = if showObCloud and obDir == 1  then splitPrice else Double.NaN;
def bullBoxBot   = if showObCloud and obDir == 1  then activeBot  else Double.NaN;
def bearBoxTop   = if showObCloud and obDir == -1 then activeTop  else Double.NaN;
def bearBoxSplit = if showObCloud and obDir == -1 then splitPrice else Double.NaN;
def bearBoxBot   = if showObCloud and obDir == -1 then activeBot  else Double.NaN;

AddCloud(bullBoxTop,   bullBoxSplit, GlobalColor("Bull"), GlobalColor("Bull"));
AddCloud(bullBoxSplit, bullBoxBot,   GlobalColor("Bull"), GlobalColor("Bull"));
AddCloud(bearBoxTop,   bearBoxSplit, GlobalColor("Bear"), GlobalColor("Bear"));
AddCloud(bearBoxSplit, bearBoxBot,   GlobalColor("Bear"), GlobalColor("Bear"));

# Buy/Sell % label at creation (replaces Pine's in-box text).
AddChartBubble(showVolumeLabels and obCreated,
    if obDir == 1 then activeTop else activeBot,
    "Buy " + Round(obBuyPct * 100, 0) + "% / Sell " + Round((1 - obBuyPct) * 100, 0) + "%",
    if obDir == 1 then GlobalColor("Bull") else GlobalColor("Bear"),
    obDir == 1);

# ---------------------------- TREND STOP LINE & CLOUD -------------------------
# Line breaks on trend flips, matching Pine's plot.style_linebr.
plot TrendStop = if trend != trend[1] then Double.NaN else stopLevel;
TrendStop.SetLineWeight(1);
TrendStop.AssignValueColor(if trend == 1 then GlobalColor("Bull") else GlobalColor("Bear"));
TrendStop.HideBubble();

def bullCloudHi = if showTrendCloud and trend == 1  then close     else Double.NaN;
def bullCloudLo = if showTrendCloud and trend == 1  then stopLevel else Double.NaN;
def bearCloudHi = if showTrendCloud and trend == -1 then stopLevel else Double.NaN;
def bearCloudLo = if showTrendCloud and trend == -1 then close     else Double.NaN;

AddCloud(bullCloudHi, bullCloudLo, GlobalColor("Bull"), GlobalColor("Bull"));
AddCloud(bearCloudHi, bearCloudLo, GlobalColor("Bear"), GlobalColor("Bear"));

# ---------------------------- RETEST SIGNALS ----------------------------------
# ta.crossover(low, active_top) == low > top AND low[1] <= top[1]; on a
# creation bar, activeTop[1] is the OLD box's recorded value -- same as Pine's
# per-bar series history. Pine's retest deliberately checks only that a box
# exists (not its direction); that is preserved. barstate.isconfirmed has no
# study equivalent: live-bar arrows can flicker until the bar closes.
def marketChange = trend != trend[1];

def buyRetestCond = showBullRetest and !isPivL and !marketChange
    and !IsNaN(activeTop) and obBuyPct >= minBuyPct / 100
    and low > activeTop and low[1] <= activeTop[1];

def sellRetestCond = showBearRetest and !isPivH and !marketChange
    and !IsNaN(activeBot) and (1 - obBuyPct) >= minSellPct / 100
    and high < activeBot and high[1] >= activeBot[1];

plot BuyRetest = buyRetestCond;
BuyRetest.SetPaintingStrategy(PaintingStrategy.BOOLEAN_ARROW_UP);
BuyRetest.SetDefaultColor(GlobalColor("Bull"));
BuyRetest.SetLineWeight(2);

plot SellRetest = sellRetestCond;
SellRetest.SetPaintingStrategy(PaintingStrategy.BOOLEAN_ARROW_DOWN);
SellRetest.SetDefaultColor(GlobalColor("Bear"));
SellRetest.SetLineWeight(2);

# Optional alerts (uncomment to use)
# Alert(buyRetestCond,  "Bullish OB Retest", Alert.BAR, Sound.Ding);
# Alert(sellRetestCond, "Bearish OB Retest", Alert.BAR, Sound.Ding);
Last edited by a moderator:


