Author Message:
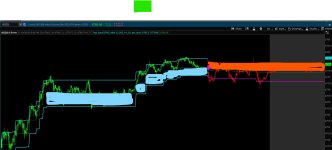
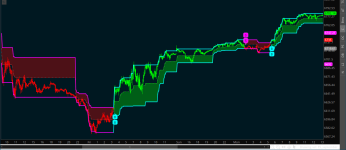
The Volatility Trend Bands [UAlgo] is a trend-following indicator that combines the concepts of volatility and trend detection. Built using the Average True Range (ATR) to measure volatility, this indicator dynamically adjusts upper and lower bands around price movements. The bands act as dynamic support and resistance levels, making it easier to identify trend shifts and potential entry and exit points.
CODE:
CSS:
#// Indicator for TOS
#// © UAlgo
#indicator("Volatility Trend Bands [UAlgo]", overlay = true, shorttitle="Volatility Trend Bands [UAlgo]")
# Converted by Sam4Cok@Samer800    - 09/2024

input timeframe = AggregationPeriod.MIN;
input Source    = FundamentalType.CLOSE; # "Price Source"
input atrLength     = 14; # "ATR Length",
input atrMultiplier = 5.0; # "ATR Multiplier"
input ColorBars     = yes ;# "Enable Bar Colors"
input ShowSignals   = yes ;# "Show Signals"

def na = Double.NaN;
def current = GetAggregationPeriod();
def tf = Max(current, timeframe);
def src = Fundamental(FundamentalType = Source, Period = tf);
def tr = TrueRange(high(Period = tf), close(Period = tf), low(Period = tf));
def nATR = WildersAverage(tr, atrLength);
def atrDelta = atrMultiplier * nATR;

script getVolatilityBands {
    input priceSource = close;
    input atrDelta = 1;
    def upperBand; # = 0.0
    def lowerBand; # = 0.0
    def upper = CompoundValue(1, upperBand[1], priceSource);
    def lower = CompoundValue(1, lowerBand[1], priceSource);
    if priceSource > upperBand[1] {
        upperBand = Max(upperBand[1], Max(priceSource, priceSource[1]));
        lowerBand = if (upperBand - atrDelta) < lowerBand[1] or ((upperBand - atrDelta) > lowerBand[1]
                    and upperBand == upperBand[1]) then lowerBand[1] else (upperBand - atrDelta);
    } else if priceSource < lowerBand[1] {
        lowerBand = Min(lowerBand[1], Min(priceSource, priceSource[1]));
        upperBand = if (lowerBand + atrDelta) > (upperBand[1]) or ((lowerBand + atrDelta) < (upperBand[1])
                    and lowerBand == lowerBand[1]) then upperBand[1] else (lowerBand + atrDelta);
    } else {
        upperBand = upper;
        lowerBand = lower;
    }

    plot up = if !isNaN(close) and upperBand then upperBand else Double.NaN;
    plot dn = if !isNaN(close) and lowerBand then lowerBand else Double.NaN;
}

def upperBand = getVolatilityBands(src, atrDelta).up;
def lowerBand = getVolatilityBands(src, atrDelta).dn;
def midBand = (lowerBand + upperBand) / 2;
def isTrendUp   = midBand > midBand[1];
def isTrendDown = midBand < midBand[1];
def lastTrendState = if isTrendUp then 1 else if isTrendDown then -1 else lastTrendState[1];

def buySignal  = isTrendUp and (lastTrendState[1] < 0);
def sellSignal = isTrendDown and (lastTrendState[1] > 0);
def col = if midBand < midBand[1] then -1 else
          if midBand > midBand[1] then 1 else col[1];

#-- PLots

plot upBand = upperBand;  # "Upper Band"
plot dnBand = lowerBand;  # "Lower Band"
plot mdLine = midBand; #
upBand.SetLineWeight(2);
dnBand.SetLineWeight(2);
upBand.AssignValueColor(if col>0 then Color.CYAN else
                        if col<0 then Color.MAGENTA else Color.GRAY);
dnBand.AssignValueColor(if col>0 then Color.CYAN else
                        if col<0 then Color.MAGENTA else Color.GRAY);
mdLine.SetDefaultColor(Color.GRAY);
mdLine.SetStyle(Curve.SHORT_DASH);

#-- Signals
def Offset = atr(14) * 0.5;
AddChartBubble(ShowSignals and buySignal, low - Offset, "B", Color.CYAN, no);
AddChartBubble(ShowSignals and sellSignal, high + Offset, "S", Color.MAGENTA);

#-- Bar Color

AssignPriceColor(if !ColorBars then Color.CURRENT else
                 if col>0 then Color.GREEN else
                 if col<0 then Color.RED else Color.GRAY);

#-- END of CODE
Last edited by a moderator: