Visual Multiple Time Frame Chart

petech

Member
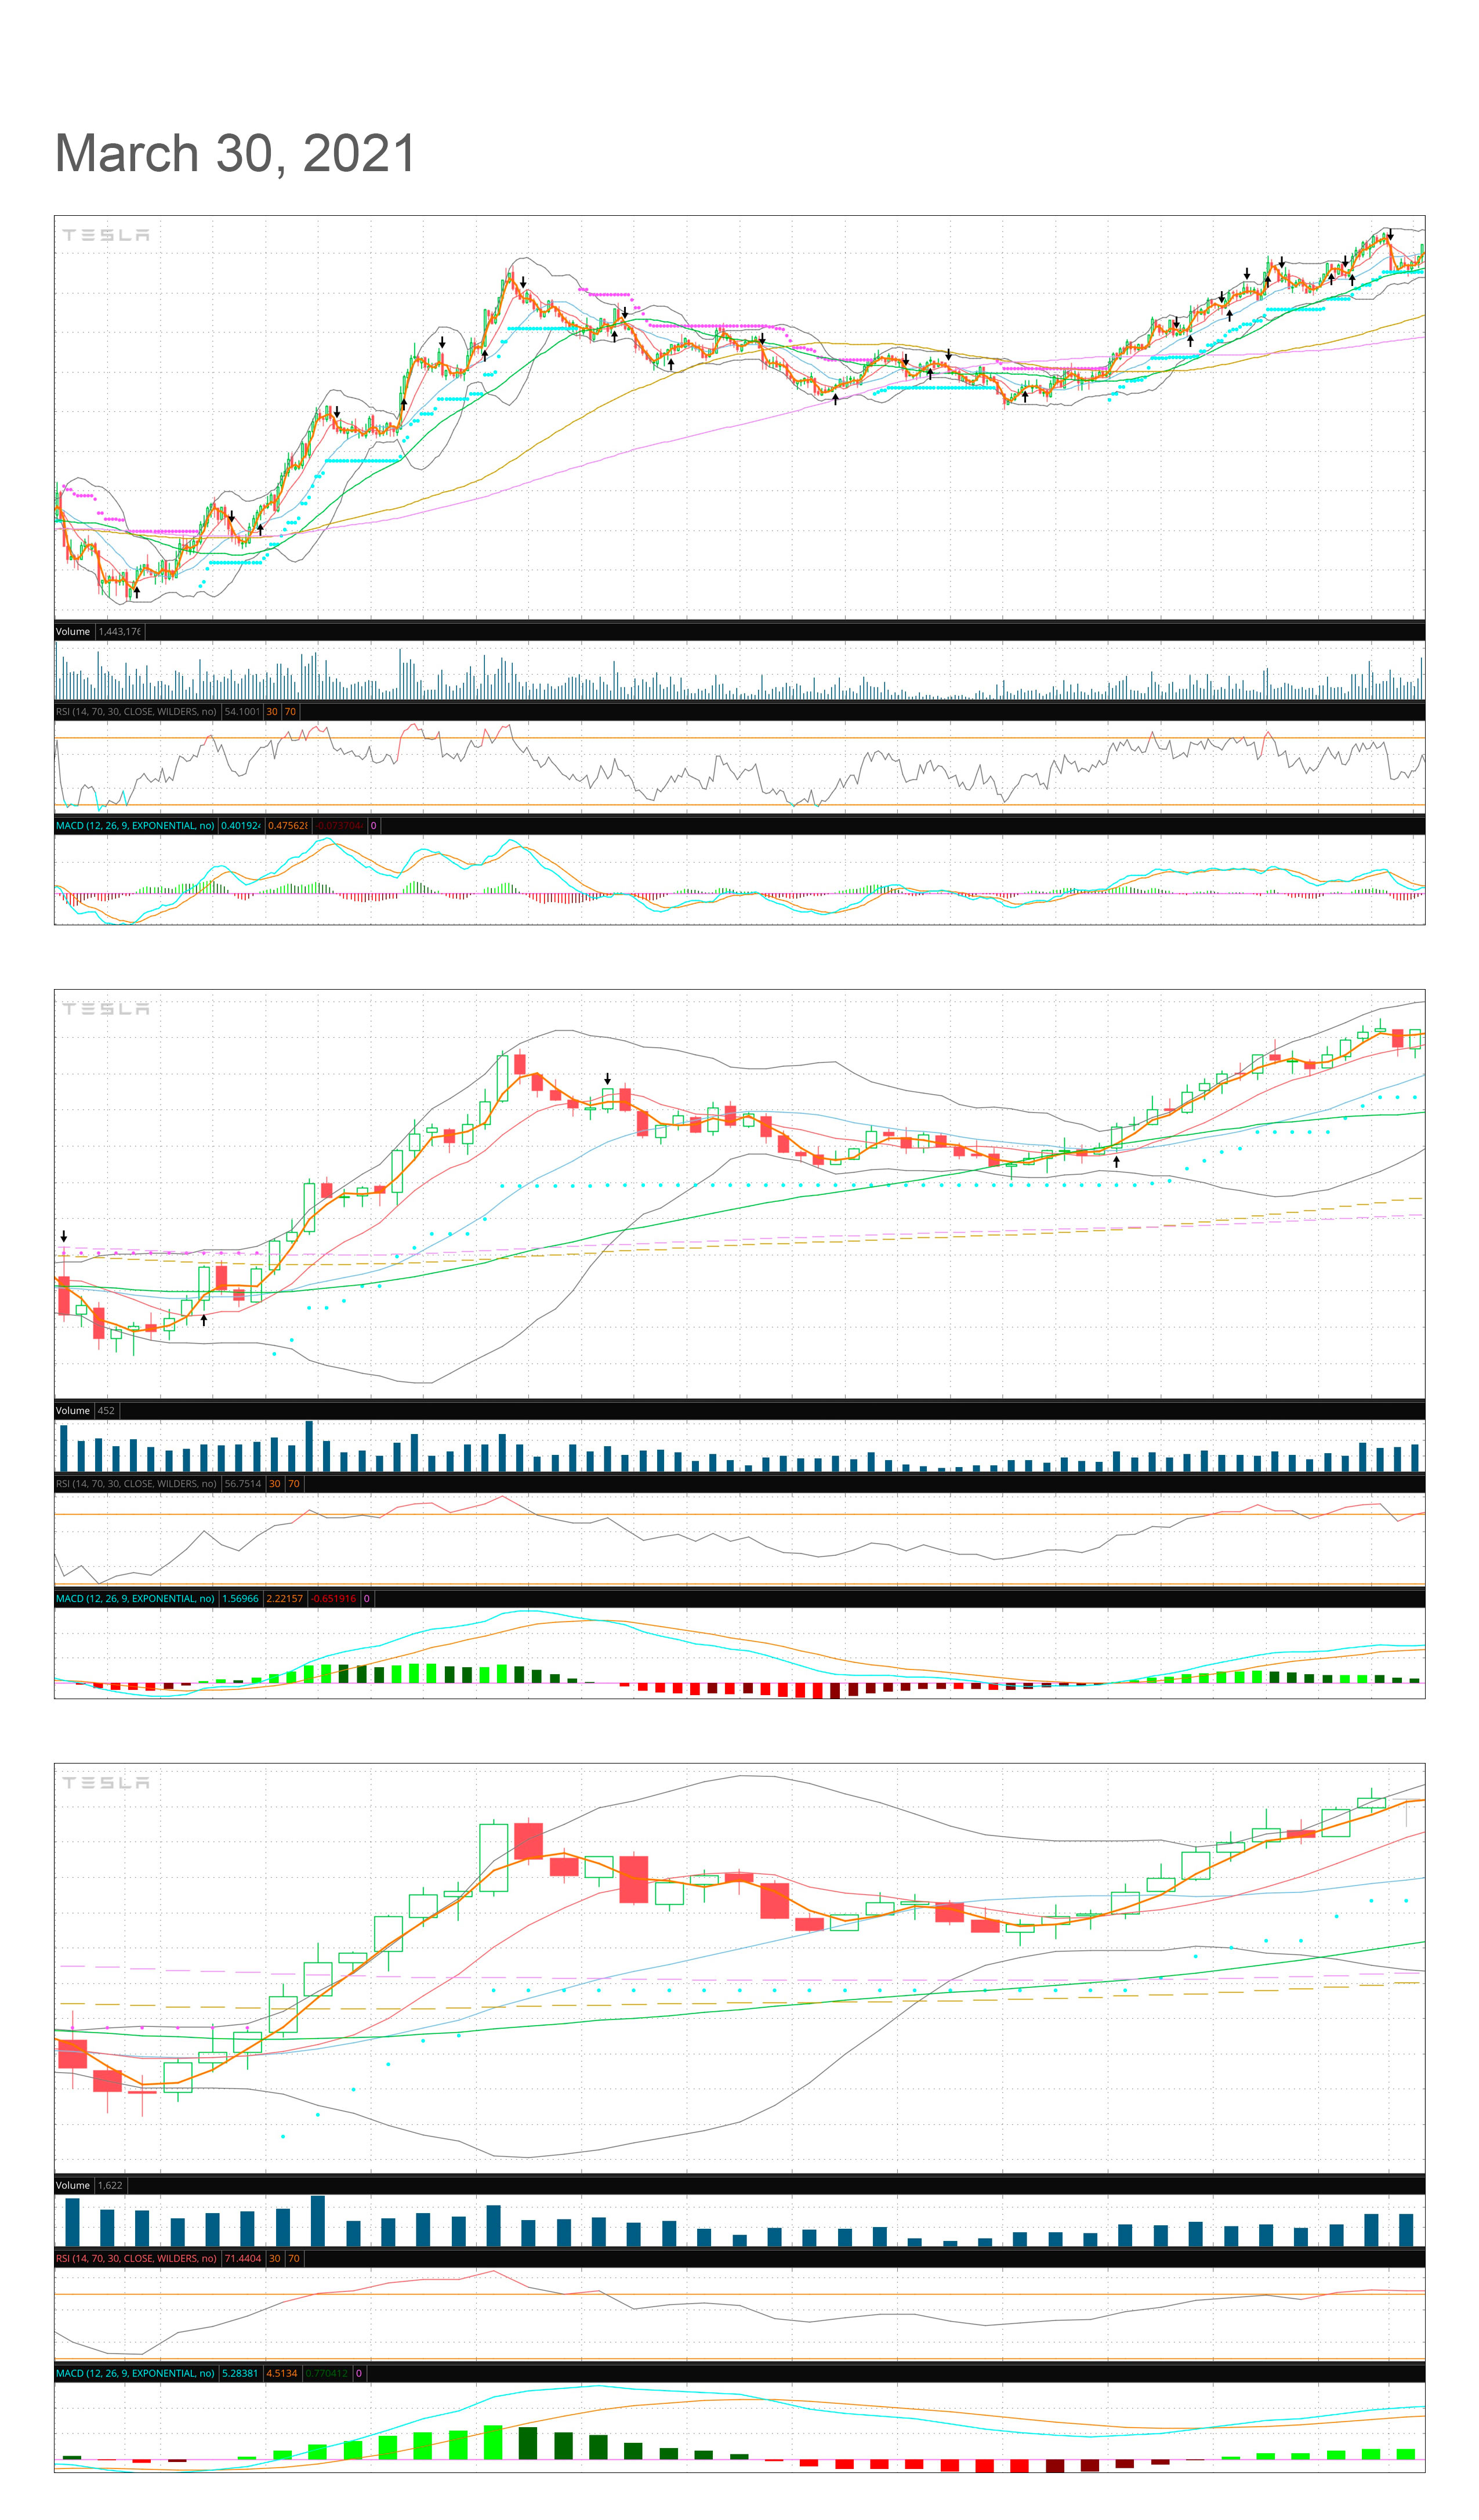
I'm wondering if there was some way to look at candles from multiple time frames on one single chart? In TOS I've clicked on the rectangle icon to and selected 3 vertical charts. The net result is that I have 3 really skinny charts on a regular laptop monitor, which is hard to look at. Below is an image I mocked up in photoshop of the 1/5/10 mins chart. I like looking at the charts vertically and it being perfectly aligned because I think it helps me understand how to read charts. I've done a search on this site already for 'multiple time frame', and I spent an hour scanning through various posts on MTF, I didn't see what I was looking for. This is just a 'nice to have' question. If I want it badly enough, I can just spend the time to keep mocking up more daily charts in Photoshop.

RszTRm2.jpg
 
While I have seen pictures from some commercial tools that will look pretty, the basic functionality can be had with code like this:

I think there are a few other threads here about it, but my brain is fried today. @BenTen may be able to help add a few to this if it is warranted.
Code:
declare upper;

input secondary_agg = AggregationPeriod.FIFTEEN_MIN;

def h = high(period = secondary_agg);
def o = open(period = secondary_agg);
def c = close(period = secondary_agg);
def l = low(period = secondary_agg);

def up_dn = if c > o then 1 else 0;

plot red_upper_line = if up_dn == 0 then c else double.nan;
plot red_lower_line = if up_dn == 0 then o else double.nan;

plot grn_upper_line = if up_dn == 1 then c else double.nan;
plot grn_lower_line = if up_dn == 1 then o else double.nan;

addcloud(red_upper_line, red_lower_line, color.red, color.red);
addcloud(grn_upper_line, grn_lower_line, color.green, color.green);

That should get you started. It's not pretty, but it has the open and close. You can change it to highs and lows, etc...

Happy Trading,
-mashume
 
@petech Using a laptop has its limitations as I can attest, unless you have a 17" or 19" hulk of a laptop... Or you use an auxiliary display... As @mashume has alluded to, there are workarounds, but they add their own complexities into the mix... Personally, I only go as far as two vertical side-by-side charts on my laptop... If I do a 4-Up chart panel I eliminate all of the lower indicators, but I only use those for monitoring multiple timeframes for trend confirmations... For efficient trading I use a three display trading station with multiple different panels configured for each one that I can switch between... It all boils down to how complicated we want things or how we can live within imitations...
 
@mashume Thank you very much. I've installed your code and have taken a look. It is cool. I'll need to spend some more time over the next few days looking over this.

@rad14733 Your suggestion about auxiliary display, I was thinking about that after I wrote my OP and went on a walk. I have an unused monitor in the other room. I should bring it over and plug it in and turn it vertical. Then maybe I can see multi time frame charts and have them all align. Too bad I didn't think of this earlier.

If your laptop has a VGA port, go for it... Newer laptops require a USB adapter and can may be able to use as many external displays as there are USB ports... I've never researched whether a USB Hub could also be implemented to extend beyond the physical number of ports on the laptop...
 
@rad14733 I set it up. Below is the image. This external monitor is 15.6 inches. So not huge. Thus it makes looking at the 1 min chart 'difficult'...lol. Though not a big deal. I'm more interested in the 5 mins and 10 mins. I've seen that there are numerous multiple time frame scripts/indicators on this site, I just wanted to visually see for myself what candles look like on MTF at the same time, vertically stacked.

DlJQQYr.jpg
 
Try this. Candle overlays of different TF's http://tos.mx/ni4mvNk
Thanks for sharing this with me. I don't know how to use it. First I installed it an nothing appeared in TOS. So I went to youtube to search. I found this video that explains how to install manually.
So I followed those instructions and installed your link manually. Afterwards I'm taken to the TOOLS section/menu in TOS. I see your script under received items. I double click on it and nothing happens. Would it be possible for you to spare a couple more minutes of your time and give me step by step instructions on how to both install and load it up.

This is what I see in TOS after I install your study. No other window popped up.
hLeAH96.jpg
 
If your laptop has a VGA port, go for it... Newer laptops require a USB adapter and can may be able to use as many external displays as there are USB ports... I've never researched whether a USB Hub could also be implemented to extend beyond the physical number of ports on the laptop...

There are options available for HDMI and DisplayPort monitors as well. No USB-connectable displays are needed.
  • My laptop only has one HDMI but also has UCB-C so I bought a USB-C docking station that allows more HDMI/DisplayPort monitors to be connected. It also has several more USB-A ports and a USB-C port and is powered so you can use it to charge devices even when the computer is off. Just search Amazon for multi display docking station. The one I have can add 3 monitors and is an older version of this.
  • Many years ago a company I worked for used some Y-shaped HDMI cables, I'm assuming they had some electronics and not just a splitter, to connect two monitors to a single HDMI port on desktop computers.
 
Thanks for sharing this with me. I don't know how to use it. First I installed it an nothing appeared in TOS. So I went to youtube to search. I found this video that explains how to install manually.
So I followed those instructions and installed your link manually. Afterwards I'm taken to the TOOLS section/menu in TOS. I see your script under received items. I double click on it and nothing happens. Would it be possible for you to spare a couple more minutes of your time and give me step by step instructions on how to both install and load it up.

This is what I see in TOS after I install your study. No other window popped up.
hLeAH96.jpg
When you import, change the name to something that is good for you. Go to charts, edit studies, find that named study and add to the chart. I'll reply if this doesn't sort out the issue
 
When you import, change the name to something that is good for you. Go to charts, edit studies, find that named study and add to the chart. I'll reply if this doesn't sort out the issue
BTW I looked at your code and the first line reads this...
input agg = AggregationPeriod.FOUR_HOURS;

But if I change it to either
input agg = AggregationPeriod.ONE_HOURS;

Or this
input agg = AggregationPeriod.ONE_HOUR;

Or this
input agg = AggregationPeriod.SIXTY_MIN;

It doesn't work. What am I doing wrong?
 
@mashume Thank you
@Vorlauf Now that I know how to edit your script and make new ones out of them. I can stacked them. Bit of a mess to look at though...lol. Though so far I'm quite intrigued with looking at multiple time frames on the one chart.

TSLA 5mins/1hr/4hr
HpWEuWb.jpg
 
I'm also wondering if there is a way to turn the opacity down on the red and green bars.

On this page
https://tlc.thinkorswim.com/center/reference/thinkScript/Constants/AggregationPeriod
I searched for both 'opacity' and 'transparency'. Nothing came up. I'm not sure what other name it might be under, if it exists at all.
If you go to the trouble of defining global colors, and then specify the global color for the cloud, then in the indicator settings you can click on the globals section, click to edit the colors, and (if you select rgb or cmyk for example) set the alpha or transparency for the global color.

There is no way I have found to set the alpha channel in the thinkscript code.

hope that helps,
mashume
Thank you :)
 
If you go to the trouble of defining global colors, and then specify the global color for the cloud, then in the indicator settings you can click on the globals section, click to edit the colors, and (if you select rgb or cmyk for example) set the alpha or transparency for the global color.

There is no way I have found to set the alpha channel in the thinkscript code.

hope that
Thank you :)

Hi @mashume @rad14733


Is there a way to do MTF in a scan?

I tried several times yesterday and today, but the scanner says that multiple aggregation periods are not allowed.
I’m trying to code for when the current vwap on the 1 minute chart is more than the vwap from the high of the last five

I’m referring to putting MTF in the code, not selecting the timeframe option on the drop down in the scanner.


Thank You!
 

Join useThinkScript to post your question to a community of 21,000+ developers and traders.

Similar threads

Not the exact question you're looking for?

Start a new thread and receive assistance from our community.

87k+ Posts
517 Online
Create Post

Similar threads

Similar threads

The Market Trading Game Changer

Join 2,500+ subscribers inside the useThinkScript VIP Membership Club
  • Exclusive indicators
  • Proven strategies & setups
  • Private Discord community
  • ‘Buy The Dip’ signal alerts
  • Exclusive members-only content
  • Add-ons and resources
  • 1 full year of unlimited support

Frequently Asked Questions

What is useThinkScript?

useThinkScript is the #1 community of stock market investors using indicators and other tools to power their trading strategies. Traders of all skill levels use our forums to learn about scripting and indicators, help each other, and discover new ways to gain an edge in the markets.

How do I get started?

We get it. Our forum can be intimidating, if not overwhelming. With thousands of topics, tens of thousands of posts, our community has created an incredibly deep knowledge base for stock traders. No one can ever exhaust every resource provided on our site.

If you are new, or just looking for guidance, here are some helpful links to get you started.

What are the benefits of VIP Membership?
VIP members get exclusive access to these proven and tested premium indicators: Buy the Dip, Advanced Market Moves 2.0, Take Profit, and Volatility Trading Range. In addition, VIP members get access to over 50 VIP-only custom indicators, add-ons, and strategies, private VIP-only forums, private Discord channel to discuss trades and strategies in real-time, customer support, trade alerts, and much more. Learn all about VIP membership here.
How can I access the premium indicators?
To access the premium indicators, which are plug and play ready, sign up for VIP membership here.
Back
Top