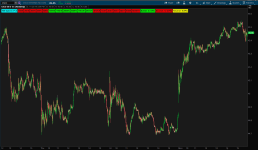
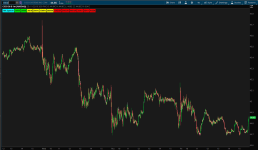
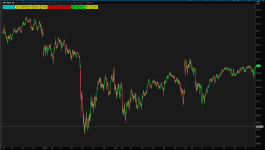
The 10X Bars offer a fantastic way to keep an eye on the quality and strength of trends

SPY

SPY
Ruby:
#Visual DMI (The 10x Bars) MTF Labels for ThinkorSwim
#Last Updated on Monday, November 25 2019 at 08:37:39 AM
#
#CREDITS
# John Carter's 10x bars, @sierioiza, @tomsk, @horserider, @markos
#
#CHANGELOG
# 2019.11.25 1.0 @diazlaz - Updated Port
# 2019.11.25 1.1 @diazlaz - Added Month Time frame
#
#DESCRIPTION
# For TSLA, we can see the 10X bars across various time frames,
# from the Weekly down to the 1-minute chart. We can see at a
# glance that there is strong GREEN momentum across most time frames.
# Any short-term red sets up a buying opportunity back in the direction
# of the longer-term greens and vice versa.
#
#
# INPUTS
input length = 14;
input averageType = AverageType.WILDERS;
# CORE
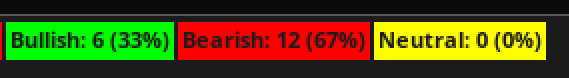
DefineGlobalColor("Bullish", Color.GREEN);
DefineGlobalColor("Bearish", Color.RED);
DefineGlobalColor("Neutral", Color.YELLOW);
AddLabel(yes, "10X System", COLOR.CYAN);
# AGGREGATION 1 - ONE MINUTE
def aM1 = aggregationPeriod.MIN;
def hiDiffM1 = high(period = aM1) - high(period = aM1)[1];
def loDiffM1 = low(period = aM1)[1] - low(period = aM1);
def plusDMM1 = if hiDiffM1 > loDiffM1 and hiDiffM1 > 0 then hiDiffM1 else 0;
def minusDMM1 = if loDiffM1 > hiDiffM1 and loDiffM1 > 0 then loDiffM1 else 0;
def ATRM1 = MovingAverage(averageType, TrueRange(high(period = aM1), close(period = aM1), low(period = aM1)), length);
def "DI+M1" = 100 * MovingAverage(averageType, plusDMM1, length) / ATRM1;
def "DI-M1" = 100 * MovingAverage(averageType, minusDMM1, length) / ATRM1;
def DXM1 = if ("DI+M1" + "DI-M1" > 0) then 100 * AbsValue("DI+M1" - "DI-M1") / ("DI+M1" + "DI-M1") else 0;
def ADXM1 = MovingAverage(averageType, DXM1, length);
def bullishM1 = ("DI+M1" > "DI-M1") and (ADXM1 > 20);
def bearishM1 = ("DI+M1" < "DI-M1") and (ADXM1 > 20);
def sidewaysM1 = (ADXM1 < 20);
AddLabel(1, "1MIN", if bullishM1 then GlobalColor("Bullish") else
if bearishM1 then GlobalColor("Bearish")
else GlobalColor("Neutral"));
# AGGREGATION 2 - TWO MINUTES
def aM2 = aggregationPeriod.TWO_MIN;
def hiDiffM2 = high(period = aM2) - high(period = aM2)[1];
def loDiffM2 = low(period = aM2)[1] - low(period = aM2);
def plusDMM2 = if hiDiffM2 > loDiffM2 and hiDiffM2 > 0 then hiDiffM2 else 0;
def minusDMM2 = if loDiffM2 > hiDiffM2 and loDiffM2 > 0 then loDiffM2 else 0;
def ATRM2 = MovingAverage(averageType, TrueRange(high(period = aM2), close(period = aM2), low(period = aM2)), length);
def "DI+M2" = 100 * MovingAverage(averageType, plusDMM2, length) / ATRM2;
def "DI-M2" = 100 * MovingAverage(averageType, minusDMM2, length) / ATRM2;
def DXM2 = if ("DI+M2" + "DI-M2" > 0) then 100 * AbsValue("DI+M2" - "DI-M2") / ("DI+M2" + "DI-M2") else 0;
def ADXM2 = MovingAverage(averageType, DXM2, length);
def bullishM2 = ("DI+M2" > "DI-M2") and (ADXM2 > 20);
def bearishM2 = ("DI+M2" < "DI-M2") and (ADXM2 > 20);
def sidewaysM2 = (ADXM2 < 20);
AddLabel(1, "2MIN", if bullishM2 then GlobalColor("Bullish") else
if bearishM2 then GlobalColor("Bearish")
else GlobalColor("Neutral"));
# AGGREGATION 3 - THREE MINUTES
def aM3 = aggregationPeriod.THREE_MIN;
def hiDiffM3 = high(period = aM3) - high(period = aM3)[1];
def loDiffM3 = low(period = aM3)[1] - low(period = aM3);
def plusDMM3 = if hiDiffM3 > loDiffM3 and hiDiffM3 > 0 then hiDiffM3 else 0;
def minusDMM3 = if loDiffM3 > hiDiffM3 and loDiffM3 > 0 then loDiffM3 else 0;
def ATRM3 = MovingAverage(averageType, TrueRange(high(period = aM3), close(period = aM3), low(period = aM3)), length);
def "DI+M3" = 100 * MovingAverage(averageType, plusDMM3, length) / ATRM3;
def "DI-M3" = 100 * MovingAverage(averageType, minusDMM3, length) / ATRM3;
def DXM3 = if ("DI+M3" + "DI-M3" > 0) then 100 * AbsValue("DI+M3" - "DI-M3") / ("DI+M3" + "DI-M3") else 0;
def ADXM3 = MovingAverage(averageType, DXM3, length);
def bullishM3 = ("DI+M3" > "DI-M3") and (ADXM3 > 20);
def bearishM3 = ("DI+M3" < "DI-M3") and (ADXM3 > 20);
def sidewaysM3 = (ADXM3 < 20);
AddLabel(1, "3MIN", if bullishM3 then GlobalColor("Bullish") else
if bearishM3 then GlobalColor("Bearish")
else GlobalColor("Neutral"));
# AGGREGATION 4 - FIVE MINUTES
def aM5 = aggregationPeriod.FIVE_MIN;
def hiDiffM5 = high(period = aM5) - high(period = aM5)[1];
def loDiffM5 = low(period = aM5)[1] - low(period = aM5);
def plusDMM5 = if hiDiffM5 > loDiffM5 and hiDiffM5 > 0 then hiDiffM5 else 0;
def minusDMM5 = if loDiffM5 > hiDiffM5 and loDiffM5 > 0 then loDiffM5 else 0;
def ATRM5 = MovingAverage(averageType, TrueRange(high(period = aM5), close(period = aM5), low(period = aM5)), length);
def "DI+M5" = 100 * MovingAverage(averageType, plusDMM5, length) / ATRM5;
def "DI-M5" = 100 * MovingAverage(averageType, minusDMM5, length) / ATRM5;
def DXM5 = if ("DI+M5" + "DI-M5" > 0) then 100 * AbsValue("DI+M5" - "DI-M5") / ("DI+M5" + "DI-M5") else 0;
def ADXM5 = MovingAverage(averageType, DXM5, length);
def bullishM5 = ("DI+M5" > "DI-M5") and (ADXM5 > 20);
def bearishM5 = ("DI+M5" < "DI-M5") and (ADXM5 > 20);
def sidewaysM5 = (ADXM5 < 20);
AddLabel(1, "5MIN", if bullishM5 then GlobalColor("Bullish") else
if bearishM5 then GlobalColor("Bearish")
else GlobalColor("Neutral"));
# AGGREGATION 5 - FIFTEEN MINUTES
def aM15 = aggregationPeriod.FIFTEEN_MIN;
def hiDiffM15 = high(period = aM15) - high(period = aM15)[1];
def loDiffM15 = low(period = aM15)[1] - low(period = aM15);
def plusDMM15 = if hiDiffM15 > loDiffM15 and hiDiffM15 > 0 then hiDiffM15 else 0;
def minusDMM15 = if loDiffM15 > hiDiffM15 and loDiffM15 > 0 then loDiffM15 else 0;
def ATRM15 = MovingAverage(averageType, TrueRange(high(period = aM15), close(period = aM15), low(period = aM15)), length);
def "DI+M15" = 100 * MovingAverage(averageType, plusDMM15, length) / ATRM15;
def "DI-M15" = 100 * MovingAverage(averageType, minusDMM15, length) / ATRM15;
def DXM15 = if ("DI+M15" + "DI-M15" > 0) then 100 * AbsValue("DI+M15" - "DI-M15") / ("DI+M15" + "DI-M15") else 0;
def ADXM15 = MovingAverage(averageType, DXM15, length);
def bullishM15 = ("DI+M15" > "DI-M15") and (ADXM15 > 20);
def bearishM15 = ("DI+M15" < "DI-M15") and (ADXM15 > 20);
def sidewaysM15 = (ADXM15 < 20);
AddLabel(1, "15MIN", if bullishM15 then GlobalColor("Bullish") else
if bearishM15 then GlobalColor("Bearish")
else GlobalColor("Neutral"));
# AGGREGATION 6 - THIRTY MINUTES
def aM30 = aggregationPeriod.THIRTY_MIN;
def hiDiffM30 = high(period = aM30) - high(period = aM30)[1];
def loDiffM30 = low(period = aM30)[1] - low(period = aM30);
def plusDMM30 = if hiDiffM30 > loDiffM30 and hiDiffM30 > 0 then hiDiffM30 else 0;
def minusDMM30 = if loDiffM30 > hiDiffM30 and loDiffM30 > 0 then loDiffM30 else 0;
def ATRM30 = MovingAverage(averageType, TrueRange(high(period = aM30), close(period = aM30), low(period = aM30)), length);
def "DI+M30" = 100 * MovingAverage(averageType, plusDMM30, length) / ATRM30;
def "DI-M30" = 100 * MovingAverage(averageType, minusDMM30, length) / ATRM30;
def DXM30 = if ("DI+M30" + "DI-M30" > 0) then 100 * AbsValue("DI+M30" - "DI-M30") / ("DI+M30" + "DI-M30") else 0;
def ADXM30 = MovingAverage(averageType, DXM30, length);
def bullishM30 = ("DI+M30" > "DI-M30") and (ADXM30 > 20);
def bearishM30 = ("DI+M30" < "DI-M30") and (ADXM30 > 20);
def sidewaysM30 = (ADXM30 < 20);
AddLabel(1, "30MIN", if bullishM30 then GlobalColor("Bullish") else
if bearishM30 then GlobalColor("Bearish")
else GlobalColor("Neutral"));
# AGGREGATION 7 - HOUR
def aH1 = aggregationPeriod.HOUR;
def hiDiffH1 = high(period = aH1) - high(period = aH1)[1];
def loDiffH1 = low(period = aH1)[1] - low(period = aH1);
def plusDMH1 = if hiDiffH1 > loDiffH1 and hiDiffH1 > 0 then hiDiffH1 else 0;
def minusDMH1 = if loDiffH1 > hiDiffH1 and loDiffH1 > 0 then loDiffH1 else 0;
def ATRH1 = MovingAverage(averageType, TrueRange(high(period = aH1), close(period = aH1), low(period = aH1)), length);
def "DI+H1" = 100 * MovingAverage(averageType, plusDMH1, length) / ATRH1;
def "DI-H1" = 100 * MovingAverage(averageType, minusDMH1, length) / ATRH1;
def DXH1 = if ("DI+H1" + "DI-H1" > 0) then 100 * AbsValue("DI+H1" - "DI-H1") / ("DI+H1" + "DI-H1") else 0;
def ADXH1 = MovingAverage(averageType, DXH1, length);
def bullishH1 = ("DI+H1" > "DI-H1") and (ADXH1 > 20);
def bearishH1 = ("DI+H1" < "DI-H1") and (ADXH1 > 20);
def sidewaysH1 = (ADXH1 < 20);
AddLabel(1, "1HOUR", if bullishH1 then GlobalColor("Bullish") else
if bearishH1 then GlobalColor("Bearish")
else GlobalColor("Neutral"));
# AGGREGATION 8 - TWO HOURS
def aH2 = aggregationPeriod.TWO_HOURS;
def hiDiffH2 = high(period = aH2) - high(period = aH2)[1];
def loDiffH2 = low(period = aH2)[1] - low(period = aH2);
def plusDMH2 = if hiDiffH2 > loDiffH2 and hiDiffH2 > 0 then hiDiffH2 else 0;
def minusDMH2 = if loDiffH2 > hiDiffH2 and loDiffH2 > 0 then loDiffH2 else 0;
def ATRH2 = MovingAverage(averageType, TrueRange(high(period = aH2), close(period = aH2), low(period = aH2)), length);
def "DI+H2" = 100 * MovingAverage(averageType, plusDMH2, length) / ATRH2;
def "DI-H2" = 100 * MovingAverage(averageType, minusDMH2, length) / ATRH2;
def DXH2 = if ("DI+H2" + "DI-H2" > 0) then 100 * AbsValue("DI+H2" - "DI-H2") / ("DI+H2" + "DI-H2") else 0;
def ADXH2 = MovingAverage(averageType, DXH2, length);
def bullishH2 = ("DI+H2" > "DI-H2") and (ADXH2 > 20);
def bearishH2 = ("DI+H2" < "DI-H2") and (ADXH2 > 20);
def sidewaysH2 = (ADXH2 < 20);
AddLabel(1, "2HOUR", if bullishH2 then GlobalColor("Bullish") else
if bearishH2 then GlobalColor("Bearish")
else GlobalColor("Neutral"));
# AGGREGATION 9 - FOUR HOURS
def aH4 = aggregationPeriod.FOUR_HOURS;
def hiDiffH4 = high(period = aH4) - high(period = aH4)[1];
def loDiffH4 = low(period = aH4)[1] - low(period = aH4);
def plusDMH4 = if hiDiffH4 > loDiffH4 and hiDiffH4 > 0 then hiDiffH4 else 0;
def minusDMH4 = if loDiffH4 > hiDiffH4 and loDiffH4 > 0 then loDiffH4 else 0;
def ATRH4 = MovingAverage(averageType, TrueRange(high(period = aH4), close(period = aH4), low(period = aH4)), length);
def "DI+H4" = 100 * MovingAverage(averageType, plusDMH4, length) / ATRH4;
def "DI-H4" = 100 * MovingAverage(averageType, minusDMH4, length) / ATRH4;
def DXH4 = if ("DI+H4" + "DI-H4" > 0) then 100 * AbsValue("DI+H4" - "DI-H4") / ("DI+H4" + "DI-H4") else 0;
def ADXH4 = MovingAverage(averageType, DXH4, length);
def bullishH4 = ("DI+H4" > "DI-H4") and (ADXH4 > 20);
def bearishH4 = ("DI+H4" < "DI-H4") and (ADXH4 > 20);
def sidewaysH4 = (ADXH4 < 20);
AddLabel(1, "4HOUR", if bullishH4 then GlobalColor("Bullish") else
if bearishH4 then GlobalColor("Bearish")
else GlobalColor("Neutral"));
# AGGREGATION 10 - ONE DAY
def aD1 = aggregationPeriod.DAY;
def hiDiffD1 = high(period = aD1) - high(period = aD1)[1];
def loDiffD1 = low(period = aD1)[1] - low(period = aD1);
def plusDMD1 = if hiDiffD1 > loDiffD1 and hiDiffD1 > 0 then hiDiffD1 else 0;
def minusDMD1 = if loDiffD1 > hiDiffD1 and loDiffD1 > 0 then loDiffD1 else 0;
def ATRD1 = MovingAverage(averageType, TrueRange(high(period = aD1), close(period = aD1), low(period = aD1)), length);
def "DI+D1" = 100 * MovingAverage(averageType, plusDMD1, length) / ATRD1;
def "DI-D1" = 100 * MovingAverage(averageType, minusDMD1, length) / ATRD1;
def DXD1 = if ("DI+D1" + "DI-D1" > 0) then 100 * AbsValue("DI+D1" - "DI-D1") / ("DI+D1" + "DI-D1") else 0;
def ADXD1 = MovingAverage(averageType, DXD1, length);
def bullishD1 = ("DI+D1" > "DI-D1") and (ADXD1 > 20);
def bearishD1 = ("DI+D1" < "DI-D1") and (ADXD1 > 20);
def sidewaysD1 = (ADXD1 < 20);
AddLabel(1, "1DAY", if bullishD1 then GlobalColor("Bullish") else
if bearishD1 then GlobalColor("Bearish")
else GlobalColor("Neutral"));
# AGGREGATION 11 - THREE DAYS
def aD3 = aggregationPeriod.THREE_DAYS;
def hiDiffD3 = high(period = aD3) - high(period = aD3)[1];
def loDiffD3 = low(period = aD3)[1] - low(period = aD3);
def plusDMD3 = if hiDiffD3 > loDiffD3 and hiDiffD3 > 0 then hiDiffD3 else 0;
def minusDMD3 = if loDiffD3 > hiDiffD3 and loDiffD3 > 0 then loDiffD3 else 0;
def ATRD3 = MovingAverage(averageType, TrueRange(high(period = aD3), close(period = aD3), low(period = aD3)), length);
def "DI+D3" = 100 * MovingAverage(averageType, plusDMD3, length) / ATRD3;
def "DI-D3" = 100 * MovingAverage(averageType, minusDMD3, length) / ATRD3;
def DXD3 = if ("DI+D3" + "DI-D3" > 0) then 100 * AbsValue("DI+D3" - "DI-D3") / ("DI+D3" + "DI-D3") else 0;
def ADXD3 = MovingAverage(averageType, DXD3, length);
def bullishD3 = ("DI+D3" > "DI-D3") and (ADXD3 > 20);
def bearishD3 = ("DI+D3" < "DI-D3") and (ADXD3 > 20);
def sidewaysD3 = (ADXD3 < 20);
AddLabel(1, "3DAY", if bullishD3 then GlobalColor("Bullish") else
if bearishD3 then GlobalColor("Bearish")
else GlobalColor("Neutral"));
# AGGREGATION 12 - ONE WEEK
def aW1 = aggregationPeriod.WEEK;
def hiDiffW1 = high(period = aW1) - high(period = aW1)[1];
def loDiffW1 = low(period = aW1)[1] - low(period = aW1);
def plusDMW1 = if hiDiffW1 > loDiffW1 and hiDiffW1 > 0 then hiDiffW1 else 0;
def minusDMW1 = if loDiffW1 > hiDiffW1 and loDiffW1 > 0 then loDiffW1 else 0;
def ATRW1 = MovingAverage(averageType, TrueRange(high(period = aW1), close(period = aW1), low(period = aW1)), length);
def "DI+W1" = 100 * MovingAverage(averageType, plusDMW1, length) / ATRW1;
def "DI-W1" = 100 * MovingAverage(averageType, minusDMW1, length) / ATRW1;
def DXW1 = if ("DI+W1" + "DI-W1" > 0) then 100 * AbsValue("DI+W1" - "DI-W1") / ("DI+W1" + "DI-W1") else 0;
def ADXW1 = MovingAverage(averageType, DXW1, length);
def bullishW1 = ("DI+W1" > "DI-W1") and (ADXW1 > 20);
def bearishW1 = ("DI+W1" < "DI-W1") and (ADXW1 > 20);
def sidewaysW1 = (ADXW1 < 20);
AddLabel(1, "WEEK", if bullishW1 then GlobalColor("Bullish") else
if bearishW1 then GlobalColor("Bearish")
else GlobalColor("Neutral"));
# AGGREGATION 13 - ONE MONTH
def aMM = aggregationPeriod.MONTH;
def hiDiffMM = high(period = aMM) - high(period = aMM)[1];
def loDiffMM = low(period = aMM)[1] - low(period = aMM);
def plusDMMM = if hiDiffMM > loDiffMM and hiDiffMM > 0 then hiDiffMM else 0;
def minusDMMM = if loDiffMM > hiDiffMM and loDiffMM > 0 then loDiffMM else 0;
def ATRMM = MovingAverage(averageType, TrueRange(high(period = aMM), close(period = aMM), low(period = aMM)), length);
def "DI+MM" = 100 * MovingAverage(averageType, plusDMMM, length) / ATRMM;
def "DI-MM" = 100 * MovingAverage(averageType, minusDMMM, length) / ATRMM;
def DXMM = if ("DI+MM" + "DI-MM" > 0) then 100 * AbsValue("DI+MM" - "DI-MM") / ("DI+MM" + "DI-MM") else 0;
def ADXMM = MovingAverage(averageType, DXMM, length);
def bullishMM = ("DI+MM" > "DI-MM") and (ADXMM > 20);
def bearishMM = ("DI+MM" < "DI-MM") and (ADXMM > 20);
def sidewaysMM = (ADXMM < 20);
AddLabel(1, "MONTH", if bullishMM then GlobalColor("Bullish") else
if bearishMM then GlobalColor("Bearish")
else GlobalColor("Neutral"));
# END OF Visual DMI (The 10x Bars) MTF Labels for ThinkorSwimAttachments
Last edited by a moderator:
") - updated with timecheck, instructions and periods V1.2.
- updated with timecheck, instructions and periods V1.2.