MatthewA
Active member
Code:
#____   ____.__                        _____  ____   ____    .__
#\   \ /   /|__| ______  _  __   _____/ ____\ \   \ /   /___ |  |  __ __  _____   ____
# \   V   / |  |/ __ \ \/ \/ /  /  _ \   __\   \   V   /  _ \|  | |  |  \/     \_/ __ \
#  \     /  |  \  ___/\     /  (  <_> )  |      \     (  <_> )  |_|  |  /  | |  \  ___/
#   \___/   |__|\___/  \/\_/    \____/|__|       \___/ \____/|____/____/|__|_|  /\___/


#   _                   _                _     _   _                    _
# _| |_ _ ___ ___ _____|_|___    ___ ___| |___| |_|_|_ _ ___    _ _ ___| |_ _ _____ ___
#| . | | |   | .'|     | |  _|  |  _| -_| | .'|  _| | | | -_|  | | | . | | | |     | -_|
#|___|_  |_|_|__,|_|_|_|_|___|  |_| |___|_|__,|_| |_|\_/|___|   \_/|___|_|___|_|_|_|___|
#    |___|

# Special thanks to Welkin from UseThinkScript.com

# For any asset, knowing the volume of trades is useless without context.
# We must be include patterns which are out of view of most charts.
# Large spikes and drops of Volume must considered relattive to the delta of price and the time of occurance.

#EOM colors: The Ease Of Movement ( EoM ) is the the amount of volume required to move prices. EoM was developed by Richard W. Arms, Jr., the creator of Equivolume.
#We will set the brightness of the price according to the Relative Dynamic EOM. Viewing bright EOM prices in a trending distribution indicates that it would be EASY for the trend to continue into that direction after the occasional retracements. Viewing bright EOM Volumes when the market is range-bound indicates which it will be EASY for price to drift in that range.

#DPL Lines:  We take a cautionary View of Difficult Price Lines ( DPLs ) to avoid Volumes where price will chop erratically, as these areas will be DIFFICULT to enter good trends and it is more comfortable to wait so that we may avoid uneccessary stress. The DPL lines are based on the works of Melvin E. Dickover, who developed FreedomOfMovement which takes into account price-volume behavior in order to detect points where movement of price is suddenly restricted. You may consider taking profits a bit before the next DPL line or wating to open your next position until the Difficult Volumes have weakened. You will notice that the DPL caclulations are much more accurate than simply drawing Support & Resistance Lines at recent Highs and Lows, however I would discourage the user from attempting to scalp off of bounces at the DPLs. We must take a long term View Of Volume to understand the price action as a whole.

# It is well known that Volume Accumulates while the market consolidates for the majority of time and Volume Distributes into strong trends. Only with a View of Volume can one understand when it would be more comfortable to wait or

declare upper;
declare hide_on_daily;
def h=high; def l=low; def hlc=hlc3; def c=close; def NAN=double.NAN;
input WinsorizingPercentage =5; #hint WinsorizingPercentage: % percentage to shift Normalized Values to prevent extreme arbitrary skewing.
# Traditionally Winsorizing works by replacing extreme High and Extreme Low values with and upper or lower common percentile median. However in our applicatoin we wish to simplfy the load on our computers and prevent wild shifts.

input DPLthreshold=95; #hint DPLthreshold: The required strength of a DPL where a Volume is expected to bring DIFFICULT erratic chop.

DefineGlobalColor("1stStrongest", CreateColor(0,230,255));
DefineGlobalColor("2ndStrongest", CreateColor(0,190,255));
DefineGlobalColor("3rdStrongest", CreateColor(0,150,255));
DefineGlobalColor("4thStrongest", CreateColor(0,110,255));
DefineGlobalColor("5thStrongest", CreateColor(0,70,255));
DefineGlobalColor("6thStrongest", CreateColor(0,0,200));
DefineGlobalColor("7thStrongest", CreateColor(0,0,150));
DefineGlobalColor("8thStrongest", CreateColor(0,0,100));

DefineGlobalColor("DifficultPriceLine", createcolor(75,180,255));
# VOLUME SELECTION
# Unfortunately, tick data is only available for the past 5 days in ThinkScript Servers.
def shares = If(!IsNaN(volume), volume, 1);
def oi = If(!IsNaN(open_interest), open_interest, 1);
def iv = If(!IsNaN(imp_volatility), imp_volatility, .00001);
def v;
#hint volumeSource: Choose to use either Share Volume (normal volume), Shares Per Range which is Share Volume / Range chosen below, or Trades Per Range which is Trade Volume / Range chosen below. ToS servers only store tick data for 5 days...
input volumeSource = {
    default "Share Volume",
    "OpenInterest",
    "Shares/OI",
    "ImpliedVolatility",
    "Shares/IV",
    "Shares*IV",
    "Trades/IV"

};
switch (volumeSource) {
case "Share Volume":
    v = shares;
case "OpenInterest":
    v = oi;
case "Shares/OI":
    v = shares / oi;
case "ImpliedVolatility":
    v = iv;
case "Shares/IV":
    v = shares / iv;
case "Shares*IV":
    v = shares * iv;
case "Trades/IV":
    v = shares / iv;
}

script prior {
    input of = close;
    def priorOf = if of != of[1] then of[1] else priorOf[1];
    plot
    prior = priorOf;
}

def x = BarNumber();
def x0 = if isNaN(close[-1]) and !isNaN(close) then x else x0[1]; # X0 periodization is required for the Winsorizing operation required later. Please read a bit about "Winsorization"
def rteBar = if GetTime() crosses above RegularTradingStart(GetYYYYMMDD()) then
               x else rteBar[1];
def priorRTEbar1  = prior(rteBar);
def priorRTEbar2  = prior(priorRTEbar1);
def priorRTEbar3  = prior(priorRTEbar2);
def priorRTEbar4  = prior(priorRTEbar3);
def priorRTEbar5  = prior(priorRTEbar4);
def priorRTEbar6  = prior(priorRTEbar5);
def priorRTEbar7  = prior(priorRTEbar6);

#Relative VOLUME portion
def pV1  = GetValue(v, rteBar - priorRTEbar1);
def pV2  = GetValue(v, rteBar - priorRTEbar2);
def pV3  = GetValue(v, rteBar - priorRTEbar3);
def pV4  = GetValue(v, rteBar - priorRTEbar4);
def pV5  = GetValue(v, rteBar - priorRTEbar5);
def pV6  = GetValue(v, rteBar - priorRTEbar6);
def pV7  = GetValue(v, rteBar - priorRTEbar7);

def avgPriorVol = (pV1 + pV2 + pV3 + pV4 + pV5 + pV6 + pV7) / 7;
def StdDevPriorVol = StDev(pV1 + pV2 + pV3 + pV4 + pV5 + pV6 + pV7);

def relVol = ( v - avgPriorVol ) / StdDevPriorVol;
def minVol = LowestAll(relVol);
def maxVol = HighestAll(relVol);
def normalizedRelativeVolume = 1 + (((relVol - minVol) / (maxVol - minVol)) * (100));

def relVolWinsorizeBaseline =  simpleMovingAvg(normalizedRelativeVolume, 1440);
def WinsorizingMin =  relVolWinsorizeBaseline + WinsorizingPercentage;
def WinzoringForcedMax=100 - WinsorizingMin;
def WinsorizedRelVol = if normalizedRelativeVolume> WinzoringForcedMax then WinzoringForcedMax else if normalizedRelativeVolume < WinsorizingMin then WinsorizingMin else normalizedRelativeVolume;
def minNormalizedRelVol=min(Lowestall(WinsorizedRelVol),WinsorizingPercentage);
def maxNormalizedRelVol=Highestall(WinsorizedRelVol);
def ViewOfVolumeRelativeRelVol = 1 + (((WinsorizedRelVol - minNormalizedRelVol) / (maxNormalizedRelVol - minNormalizedRelVol)) * 100); # Plot as Histogram


#Relative PRICE MOVE
input PastPriceMovePercent=50; #hint PastPriceMovePercent: The 0-100% normalized% of the price move which is compared relative to priceActionIndicator moves of previous days. Preferably greater than 50%.
def PriorDayPriceMOVE = AbsValue((hlc - hlc[1]) / (hlc[1]));
def pM1  = GetValue(PriorDayPriceMOVE, rteBar - priorRTEbar1);
def pM2  = GetValue(PriorDayPriceMOVE, rteBar - priorRTEbar2);
def pM3  = GetValue(PriorDayPriceMOVE, rteBar - priorRTEbar3);
def pM4  = GetValue(PriorDayPriceMOVE, rteBar - priorRTEbar4);
def pM5  = GetValue(PriorDayPriceMOVE, rteBar - priorRTEbar5);
def pM6  = GetValue(PriorDayPriceMOVE, rteBar - priorRTEbar6);
def pM7  = GetValue(PriorDayPriceMOVE, rteBar - priorRTEbar7);

def avgPriorMOVE = (pM1 + pM2 + pM3 + pM4 + pM5 +  pM6 + pM7 ) / 7;
def StdDevPriorMOVE = StDev(pM1 + pM2 + pM3 + pM4 + pM5 +  pM6 + pM7);
def relMOVE = ((( PriorDayPriceMOVE - avgPriorMOVE) / StdDevPriorMOVE) * (PastPriceMovePercent)) + ((PriorDayPriceMOVE) * (100 - PastPriceMovePercent));
def minMOVE = LowestAll(relMOVE);
def maxMOVE = HighestAll(relMOVE);
def normalizedMOVE = 1 + (((relMOVE - minMOVE) / (maxMOVE - minMOVE)) * (100));

# Final EASEOfMovement solution to highlight price moves which may occur in smooth trends from low orderflow....
# Strong EOMs from trends are likely to continue in the direction of that trend after the occasional pause.
# Strong EOMs that do not outside of strong trends are likely to revisit the same prices.
def EaseOfMovement = normalizedMOVE / ViewOfVolumeRelativeRelVol;
def minEoM = LowestAll(EaseOfMovement);
def maxEoM = HighestAll(EaseOfMovement);
def normalizedEase = 1 + (((EaseOfMovement - minEoM) / (maxEoM - minEoM)) * 100);
 # Nice to plot as Histogram
def WinsorizingMinEOM =  simpleMovingAvg(normalizedEase, 144);;
def WinzoringForcedMaxEOM=100 - WinsorizingMinEOM;
def WinsorizedEOM = if normalizedEase> WinzoringForcedMaxEOM then WinzoringForcedMaxEOM else if normalizedEase < WinsorizingPercentage then WinsorizingPercentage else normalizedEase;
def minNormalizedEoM=Lowestall(WinsorizedEOM);
def maxNormalizedEoM=Highestall(WinsorizedEOM);
plot ViewOfVolumeRelativeEoM =1 + (((WinsorizedEOM - minNormalizedEoM) / (maxNormalizedEoM - minNormalizedEoM)) * 100);
# Nice to plot as Histogram

input   FirstEasiestOrderFlow1st= 60; #hint FirstEasiestOrderFlow1st:
input  SecondEasiestOrderFlow2nd= 50; #hint SecondEasiestOrderFlow2nd:
input   ThirdEasiestOrderFlow3rd= 40; #hint ThirdEasiestOrderFlow3rd:
input   FouthEasiestOrderFlow4th= 30; #hint FouthEasiestOrderFlow4th:
input   FifthEasiestOrderFlow5th= 20; #hint FifthEasiestOrderFlow5th:
input   SixthEasiestOrderFlow6th= 15; #hint SixthEasiestOrderFlow6th:
input SeventhEasiestOrderFlow7th= 10; #hint SeventhEasiestOrderFlow7th:
input  EighthEasiestOrderFlow8th= 5; #hint EighthEasiestOrderFlow8th:

AssignPriceColor(
 if ViewOfVolumeRelativeEoM > FirstEasiestOrderFlow1st then GlobalColor("1stStrongest")
 else if ViewOfVolumeRelativeEoM > SecondEasiestOrderFlow2nd then GlobalColor("2ndStrongest")
 else if ViewOfVolumeRelativeEoM > ThirdEasiestOrderFlow3rd then GlobalColor("3rdStrongest")
 else if ViewOfVolumeRelativeEoM > FouthEasiestOrderFlow4th then GlobalColor("4thStrongest")
 else if ViewOfVolumeRelativeEoM > FifthEasiestOrderFlow5th then GlobalColor("5thStrongest")
 else if ViewOfVolumeRelativeEoM > SixthEasiestOrderFlow6th then GlobalColor("6thStrongest")
 else if ViewOfVolumeRelativeEoM > SeventhEasiestOrderFlow7th then GlobalColor("7thStrongest")
 else if ViewOfVolumeRelativeEoM > EighthEasiestOrderFlow8th then GlobalColor("8thStrongest")
 else Color.Black);

# Final FOM solution to draw the 'Defended Price Line' (DPL) where trading is overencumbered with Volumes...
#We expect choppiness and erratic stop outs to randomly provide and restrict liquidity near DPLs and we prefer not to trade in these DIFFICULT DPLs.
def FreedomMOVEMENT = ViewOfVolumeRelativeRelVol / normalizedMOVE;
def relFOM = 1/ViewOfVolumeRelativeEoM;
def minFOM = LowestAll(relFOM);
def maxFOM = HighestAll(relFOM);
def normalizedFOM = 1 + (((relFOM - minFOM) / (maxFOM - minFOM)) * 100); # Plot as volume


def DPLlimitLength = 60;
def DPLcheck =  (MovingAverage(AverageType.WEIGHTED, normalizedFOM, DPLlimitLength));
plot DefendedPriceLineDPL = if normalizedFOM > ((DPLcheck/2)+DPLthreshold) then close else Double.NaN;
def DPLcount= if !isNAN(DefendedPriceLineDPL) then DPLcount[1]+1 else DPLcount[1];
DefendedPriceLineDPL.setPaintingStrategy(PaintingStrategy.Squares);
DefendedPriceLineDPL.SetDefaultColor(GlobalColor("DifficultPriceLine")); DefendedPriceLineDPL.hideBubble(); DefendedPriceLineDPL.hideTitle();
DefendedPriceLineDPL.SetLineWeight(5);
addLabel(1,"| " + DPLcount  + " DPLs (Difficult Price Lines) ◽--- " + DPLthreshold +"% level |",GlobalColor("DifficultPriceLine"));

#Assign DPL lines at specific points
#######################################

rec DPLcounter;
if ( normalizedFOM > ((DPLcheck/2)+DPLthreshold) && DPLcounter[1] < 20) {
DPLcounter =DPLcounter[1] + 1;
} else {
if ( normalizedFOM > ((DPLcheck/2)+DPLthreshold) && DPLcounter[1] == 20) {
DPLcounter = 1;
} else {
DPLcounter =DPLcounter[1];
}
};
rec DifficultPrice1;
if DPLcounter==1 && DPLcounter[1]!=1 {
DifficultPrice1= close; } else {DifficultPrice1=CompoundValue(1, DifficultPrice1[1], NAN);};
plot DPL1=DifficultPrice1;
DPL1.SetPaintingStrategy(PaintingStrategy.DASHES); DPL1.hideBubble(); DPL1.hideTitle();
DPL1.SetDefaultColor(GlobalColor("DifficultPriceLine"));
DPL1.SetLineWeight(1);

rec DifficultPrice2;
if DPLcounter==2 && DPLcounter[1]!=2 {
DifficultPrice2= close; } else {DifficultPrice2=CompoundValue(1, DifficultPrice2[1], NAN);};
plot DPL2=DifficultPrice2;
DPL2.SetPaintingStrategy(PaintingStrategy.DASHES); DPL2.hideBubble(); DPL2.hideTitle();
DPL2.SetDefaultColor(GlobalColor("DifficultPriceLine"));
DPL2.SetLineWeight(1);

rec DifficultPrice3;
if DPLcounter==3 && DPLcounter[1]!=3 {
DifficultPrice3= close; } else {DifficultPrice3=CompoundValue(1, DifficultPrice3[1], NAN);};
plot DPL3=DifficultPrice3;
DPL3.SetPaintingStrategy(PaintingStrategy.DASHES); DPL3.hideBubble(); DPL3.hideTitle();
DPL3.SetDefaultColor(GlobalColor("DifficultPriceLine"));
DPL3.SetLineWeight(1);

rec DifficultPrice4;
if DPLcounter==4 && DPLcounter[1]!=4 {
DifficultPrice4= close; } else {DifficultPrice4=CompoundValue(1, DifficultPrice4[1], NAN);};
plot DPL4=DifficultPrice4;
DPL4.SetPaintingStrategy(PaintingStrategy.DASHES); DPL4.hideBubble(); DPL4.hideTitle();
DPL4.SetDefaultColor(GlobalColor("DifficultPriceLine"));
DPL4.SetLineWeight(1);

rec DifficultPrice5;
if DPLcounter==5 && DPLcounter[1]!=5 {
DifficultPrice5= close; } else {DifficultPrice5=CompoundValue(1, DifficultPrice5[1], NAN);};
plot DPL5=DifficultPrice5;
DPL5.SetPaintingStrategy(PaintingStrategy.DASHES); DPL5.hideBubble(); DPL5.hideTitle();
DPL5.SetDefaultColor(GlobalColor("DifficultPriceLine"));
DPL5.SetLineWeight(1);

rec DifficultPrice6;
if DPLcounter==6 && DPLcounter[1]!=6 {
DifficultPrice6= close; } else {DifficultPrice6=CompoundValue(1, DifficultPrice6[1], NAN);};
plot DPL6=DifficultPrice6;
DPL6.SetPaintingStrategy(PaintingStrategy.DASHES); DPL6.hideBubble(); DPL6.hideTitle();
DPL6.SetDefaultColor(GlobalColor("DifficultPriceLine"));
DPL6.SetLineWeight(1);

rec DifficultPrice7;
if DPLcounter==7 && DPLcounter[1]!=7 {
DifficultPrice7= close; } else {DifficultPrice7=CompoundValue(1, DifficultPrice7[1], NAN);};
plot DPL7=DifficultPrice7;
DPL7.SetPaintingStrategy(PaintingStrategy.DASHES); DPL7.hideBubble(); DPL7.hideTitle();
DPL7.SetDefaultColor(GlobalColor("DifficultPriceLine"));
DPL7.SetLineWeight(1);

rec DifficultPrice8;
if DPLcounter==8 && DPLcounter[1]!=8 {
DifficultPrice8= close; } else {DifficultPrice8=CompoundValue(1, DifficultPrice8[1], NAN);};
plot DPL8=DifficultPrice8;
DPL8.SetPaintingStrategy(PaintingStrategy.DASHES); DPL8.hideBubble(); DPL8.hideTitle();
DPL8.SetDefaultColor(GlobalColor("DifficultPriceLine"));
DPL8.SetLineWeight(1);

rec DifficultPrice9;
if DPLcounter==9 && DPLcounter[1]!=9 {
DifficultPrice9= close; } else {DifficultPrice9=CompoundValue(1, DifficultPrice9[1], NAN);};
plot DPL9=DifficultPrice9;
DPL9.SetPaintingStrategy(PaintingStrategy.DASHES); DPL9.hideBubble(); DPL9.hideTitle();
DPL9.SetDefaultColor(GlobalColor("DifficultPriceLine"));
DPL9.SetLineWeight(1);

rec DifficultPrice10;
if DPLcounter==10 && DPLcounter[1]!=10 {
DifficultPrice10= close; } else {DifficultPrice10=CompoundValue(1, DifficultPrice10[1], NAN);};
plot DPL10=DifficultPrice10;
DPL10.SetPaintingStrategy(PaintingStrategy.DASHES); DPL10.hideBubble(); DPL10.hideTitle();
DPL10.SetDefaultColor(GlobalColor("DifficultPriceLine"));
DPL10.SetLineWeight(1);

rec DifficultPrice11;
if DPLcounter==11 && DPLcounter[1]!=11 {
DifficultPrice11= close; } else {DifficultPrice11=CompoundValue(1, DifficultPrice11[1], NAN);};
plot DPL11=DifficultPrice11;
DPL11.SetPaintingStrategy(PaintingStrategy.DASHES); DPL11.hideBubble(); DPL11.hideTitle();
DPL11.SetDefaultColor(GlobalColor("DifficultPriceLine"));
DPL11.SetLineWeight(1);

rec DifficultPrice12;
if DPLcounter==12 && DPLcounter[1]!=12 {
DifficultPrice12= close; } else {DifficultPrice12=CompoundValue(1, DifficultPrice12[1], NAN);};
plot DPL12=DifficultPrice12;
DPL12.SetPaintingStrategy(PaintingStrategy.DASHES); DPL12.hideBubble(); DPL12.hideTitle();
DPL12.SetDefaultColor(GlobalColor("DifficultPriceLine"));
DPL12.SetLineWeight(1);

rec DifficultPrice13;
if DPLcounter==13 && DPLcounter[1]!=13 {
DifficultPrice13= close; } else {DifficultPrice13=CompoundValue(1, DifficultPrice13[1], NAN);};
plot DPL13=DifficultPrice13;
DPL13.SetPaintingStrategy(PaintingStrategy.DASHES); DPL13.hideBubble(); DPL13.hideTitle();
DPL13.SetDefaultColor(GlobalColor("DifficultPriceLine"));
DPL13.SetLineWeight(1);

rec DifficultPrice14;
if DPLcounter==14 && DPLcounter[1]!=14 {
DifficultPrice14= close; } else {DifficultPrice14=CompoundValue(1, DifficultPrice14[1], NAN);};
plot DPL14=DifficultPrice14;
DPL14.SetPaintingStrategy(PaintingStrategy.DASHES); DPL14.hideBubble(); DPL14.hideTitle();
DPL14.SetDefaultColor(GlobalColor("DifficultPriceLine"));
DPL14.SetLineWeight(1);

rec DifficultPrice15;
if DPLcounter==15 && DPLcounter[1]!=15 {
DifficultPrice15= close; } else {DifficultPrice15=CompoundValue(1, DifficultPrice15[1], NAN);};
plot DPL15=DifficultPrice15;
DPL15.SetPaintingStrategy(PaintingStrategy.DASHES); DPL15.hideBubble(); DPL15.hideTitle();
DPL15.SetDefaultColor(GlobalColor("DifficultPriceLine"));
DPL15.SetLineWeight(1);

rec DifficultPrice16;
if DPLcounter==16 && DPLcounter[1]!=16 {
DifficultPrice16= close; } else {DifficultPrice16=CompoundValue(1, DifficultPrice16[1], NAN);};
plot DPL16=DifficultPrice16;
DPL16.SetPaintingStrategy(PaintingStrategy.DASHES); DPL16.hideBubble(); DPL16.hideTitle();
DPL16.SetDefaultColor(GlobalColor("DifficultPriceLine"));
DPL16.SetLineWeight(1);


rec DifficultPrice17;
if DPLcounter==17 && DPLcounter[1]!=17 {
DifficultPrice17= close; } else {DifficultPrice17=CompoundValue(1, DifficultPrice17[1], NAN);};
plot DPL17=DifficultPrice17;
DPL17.SetPaintingStrategy(PaintingStrategy.DASHES); DPL17.hideBubble(); DPL17.hideTitle();
DPL17.SetDefaultColor(GlobalColor("DifficultPriceLine"));
DPL17.SetLineWeight(1);

rec DifficultPrice18;
if DPLcounter==18 && DPLcounter[1]!=18 {
DifficultPrice18= close; } else {DifficultPrice18=CompoundValue(1, DifficultPrice18[1], NAN);};
plot DPL18=DifficultPrice18;
DPL18.SetPaintingStrategy(PaintingStrategy.DASHES); DPL18.hideBubble(); DPL18.hideTitle();
DPL18.SetDefaultColor(GlobalColor("DifficultPriceLine"));
DPL18.SetLineWeight(1);

rec DifficultPrice19;
if DPLcounter==19 && DPLcounter[1]!=19 {
DifficultPrice19= close; } else {DifficultPrice19=CompoundValue(1, DifficultPrice19[1], NAN);};
plot DPL19=DifficultPrice19;
DPL19.SetPaintingStrategy(PaintingStrategy.DASHES); DPL19.hideBubble(); DPL19.hideTitle();
DPL19.SetDefaultColor(GlobalColor("DifficultPriceLine"));
DPL19.SetLineWeight(1);


rec DifficultPrice20;
if DPLcounter==20 && DPLcounter[1]!=20 {
DifficultPrice20= close; } else {DifficultPrice20=CompoundValue(1, DifficultPrice20[1], NAN);};
plot DPL20=DifficultPrice20;
DPL20.SetPaintingStrategy(PaintingStrategy.DASHES); DPL20.hideBubble(); DPL20.hideTitle();
DPL20.SetDefaultColor(GlobalColor("DifficultPriceLine"));
DPL20.SetLineWeight(1);

### Caution Relative Volume compares the current OrderFlow to the Volume of the EXACT same time of day for several times. For instance the Volume usually increases in the first minute after 9:30 AM EST as the NewYork WallStreet Opens... It would be completely meaningless to compare the open Volume to any other time of day except the market open of the previous days.
#Testing enough Data is loaded to calculate Relative Volumes
def CalendarDays = GetYYYYMMDD();
def NumberOfCalendarDaysOnChart = DaysFromDate(First(CalendarDays)) + GetDayOfWeek(First(CalendarDays));
AddLabel(NumberOfCalendarDaysOnChart <10, "RelativeVolume Error: Only " + NumberOfCalendarDaysOnChart + " days loaded on chart...Please add more days", Color.RED);


AddLabel(PastPriceMovePercent <40, " Caution: RelativePriceMove is only " + PastPriceMovePercent + " %. Please consider a larger relative price comparison to the past days.", Color.YELLOW);
Last edited by a moderator:


 that's how some people learned perfect pronunciation.


 .
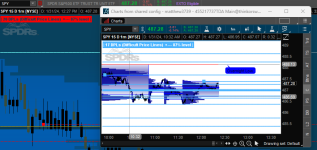
. , the price made fake breakouts into the DPLs and then turned abruptly back to the price range of the bright easy EOM bars from the premarket. I imagine the market considered the large number of people entering long just below the top DPLs and the surge of people entering short just above the bottom DPL as trapped liquidity