Yes, that works! Since you are using constants (A,B,C) you do not need the fold code and could simpy use something like the following
I went ahead and modified again. It works. My end goal is to use it as customizable seasonality chart. I'm currently viewing on a Daily chart for 1 year, but would like to view the specific dates in prior years as well. Is this possible?
declare lower;
input XLE_start1 = 20240210;
input XLE_end1 = 20240530;
input XLE_start2 = 20240815;
input XLE_end2 = 20240915;
input XLE_start3 = 20241115;
input XLE_end3 = 20241222;
input TOP = 0.9;
input BTM = 0.85;
input hideplots = yes;
input verticals = yes;
plot HIGH = 1.0;
HIGH.SetDefaultColor(CreateColor(025, 025, 025));
plot LOW = 0.0;
LOW.SetDefaultColor(CreateColor (025, 025, 025));
#----------------------------------------------------------------------------------------------------------- >>>
def XLE_Range_1_start = (GetYYYYMMDD()[1] < XLE_start1 and GetYYYYMMDD() >= XLE_start1);
def XLE_Range_1_end = (GetYYYYMMDD() <= XLE_end1 and GetYYYYMMDD()[-1] > XLE_end1);
def XLE_Range_2_start = (GetYYYYMMDD()[1] < XLE_start2 and GetYYYYMMDD() >= XLE_start2);
def XLE_Range_2_end = (GetYYYYMMDD() <= XLE_end2 and GetYYYYMMDD()[-1] > XLE_end2);
def XLE_Range_3_start = (GetYYYYMMDD()[1] < XLE_start3 and GetYYYYMMDD() >= XLE_start3);
def XLE_Range_3_end = (GetYYYYMMDD() <= XLE_end3 and GetYYYYMMDD()[-1] > XLE_end3);
def bn = BarNumber();
def na = Double.NaN;
def rng = if bn == 1 then 0
else if XLE_Range_1_start or XLE_Range_2_start or XLE_Range_3_start then 1
else if XLE_Range_1_end or XLE_Range_2_end or XLE_Range_3_end then 0
else rng[1];
#----------------------------------------------------------------------------------------------------------- >>>
def lastbar = HighestAll(if !IsNaN(TOP) then bn else na);
def look_back_bars_max = lastbar - HighestAll(if XLE_Range_1_start or XLE_Range_2_start or XLE_Range_3_start then bn else na);
def look_back_bars_min = lastbar - HighestAll(if XLE_Range_1_end or XLE_Range_2_end or XLE_Range_3_end then bn else na);
def hix = if !rng then na else TOP;
def lox = if !rng then na else BTM;
#----------------------------------------------------------------------------------------------------------- >>>
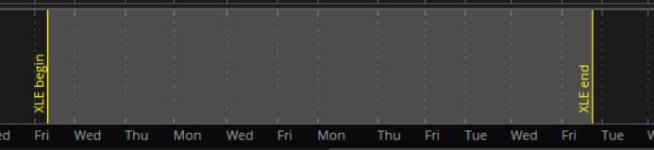
AddVerticalLine((verticals and (XLE_Range_1_start)), " BEGIN", Color.YELLOW, Curve.FIRM);
AddVerticalLine((verticals and (XLE_Range_1_end)), " END", Color.YELLOW, Curve.FIRM);
AddVerticalLine((verticals and (XLE_Range_2_start)), " BEGIN", Color.YELLOW, Curve.FIRM);
AddVerticalLine((verticals and (XLE_Range_2_end)), " END", Color.YELLOW, Curve.FIRM);
AddVerticalLine((verticals and (XLE_Range_3_start)), " BEGIN", Color.YELLOW, Curve.FIRM);
AddVerticalLine((verticals and (XLE_Range_3_end)), " END", Color.YELLOW, Curve.FIRM);
DefineGlobalColor("Cloud", CreateColor( 255, 255, 000 ) );
AddCloud( hix, lox, color1 = GlobalColor("Cloud"));
AddChartBubble(XLE_Range_1_start, TOP, "XLE", GlobalColor("Cloud"), no);
AddChartBubble(XLE_Range_2_start, TOP, "XLE", GlobalColor("Cloud"), no);
AddChartBubble(XLE_Range_3_start, TOP, "XLE", GlobalColor("Cloud"), no);