Variance from SMA

jmaxfl

New member
VIP
I am not a great script writer and have been trying to figure out how to make a badge with the standard deviation of the last price from the 200 SMA. I would appreciate any help one of you brilliant script writers with this.

Thank you all for you outstanding work.
 
Solution
I am not a great script writer and have been trying to figure out how to make a badge with the standard deviation of the last price from the 200 SMA. I would appreciate any help one of you brilliant script writers with this.

Thank you all for you outstanding work.

don't know what a badge is. i'm guessing you want a label?

this will draw a SMA200
it draws 2 labels, 1 for the SMA value and 1 for the standard deviation of the average

Code:
#avg_dev

def na = double.nan;
def bn = barnumber();
def data = close;

input avg1_type = AverageType.Simple;
input avg1_length = 200;
def avg1 = MovingAverage(avg1_type, data, avg1_length );

input show_avg1_line = yes;
plot zavg1 = if show_avg1_line then avg1 else na...
I am not a great script writer and have been trying to figure out how to make a badge with the standard deviation of the last price from the 200 SMA. I would appreciate any help one of you brilliant script writers with this.

Thank you all for you outstanding work.

don't know what a badge is. i'm guessing you want a label?

this will draw a SMA200
it draws 2 labels, 1 for the SMA value and 1 for the standard deviation of the average

Code:
#avg_dev

def na = double.nan;
def bn = barnumber();
def data = close;

input avg1_type = AverageType.Simple;
input avg1_length = 200;
def avg1 = MovingAverage(avg1_type, data, avg1_length );

input show_avg1_line = yes;
plot zavg1 = if show_avg1_line then avg1 else na;
zavg1.SetDefaultColor(Color.cyan);
zavg1.setlineweight(1);
zavg1.hidebubble();

input stdev_len = 14;
def StdDev = stdev(avg1, stdev_len);

addlabel(1, "SMA " + avg1, color.yellow);
addlabel(1, "STDEV " +stddev, color.yellow);
#

take some time to study up on some functions
https://toslc.thinkorswim.com/center/reference/thinkScript/Functions/Look---Feel/AddLabel
 
Solution

Join useThinkScript to post your question to a community of 21,000+ developers and traders.

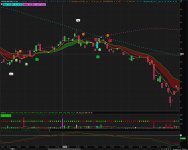
I decided that I should re-think using standard deviation and have chosen to use variance in price as my metric for this study. I still have one minor issue that I have yet to figure out how to resolve. I cannot figure out to display the type of moving average on the the label. I would appreciate any insight you may give me in resolving that. I included a chart with the example. I will provide code for my other studies if there is any interest the are shown on the example I have attached.

Here is the code as it stands now:

#JM_2MAs
#timeframe is a multiplier that allows any average time frame that is not the same as the chart time frame
#if not intra-day, then intra-day is set to one to one for daily and longer charts

def na = Double.NaN;
def bn = BarNumber();
def data = close;

input avg_type = AverageType.SIMPLE;

input intraday = yes;
input timeframe = 2;
input avg1_len = 50;
input avg2_len = 100;
input Line_Weigth =1;

#Intraday or Not
def actLen = if intraday == yes then timeframe else 1;

def avg1 = MovingAverage(avg_type, data, round(avg1_len*actLen ));
def avg2 = MovingAverage(avg_type, data, round(avg2_len*actLen));

input show_avg1_line = yes;
input show_avg2_line = yes;

plot avg1_p = if show_avg1_line then avg1 else na;
avg1_p.SetDefaultColor(CreateColor(0, 255, 255 ));
avg1_p.SetLineWeight(Line_Weigth);
avg1_P.SetStyle(Curve.points);
avg1_p.HideBubble();

plot avg2_p = if show_avg2_line then avg2 else na;
avg2_p.SetDefaultColor(CreateColor(255, 102, 255 ));
avg2_p.SetLineWeight(Line_Weigth);
avg2_p.SetStyle(Curve.points);
avg2_p.HideBubble();

def dst1 = (close-avg1) / close;
def amt1 = round(close-avg1);

def dst2 = (close- avg2) / close;
def amt2 = round(close-avg2);

# I would like to dispay the MovingAverage.type instead of just "MA" text
AddLabel(show_avg1_line,avg1_len + "MA: " +round(avg1), CreateColor(0, 255, 255)) ;
AddLabel(show_avg1_line,"Dif : "+ amt1 + " " + (asPercent(round(close-avg1)/close)), CreateColor(0, 255, 255 ));
AddLabel(show_avg2_line,avg2_len + "MA: " +round(avg2), CreateColor(255, 102, 255)) ;
AddLabel(show_avg2_line,"Dif : "+ amt2 + " " + (asPercent(round(close-avg2)/close)), CreateColor(255, 102, 255 ));

#End
 

Attachments

  • 1M_Options_Chart.JPG
    1M_Options_Chart.JPG
    249 KB · Views: 91

Similar threads

Not the exact question you're looking for?

Start a new thread and receive assistance from our community.

87k+ Posts
453 Online
Create Post

Similar threads

Similar threads

The Market Trading Game Changer

Join 2,500+ subscribers inside the useThinkScript VIP Membership Club
  • Exclusive indicators
  • Proven strategies & setups
  • Private Discord community
  • ‘Buy The Dip’ signal alerts
  • Exclusive members-only content
  • Add-ons and resources
  • 1 full year of unlimited support

Frequently Asked Questions

What is useThinkScript?

useThinkScript is the #1 community of stock market investors using indicators and other tools to power their trading strategies. Traders of all skill levels use our forums to learn about scripting and indicators, help each other, and discover new ways to gain an edge in the markets.

How do I get started?

We get it. Our forum can be intimidating, if not overwhelming. With thousands of topics, tens of thousands of posts, our community has created an incredibly deep knowledge base for stock traders. No one can ever exhaust every resource provided on our site.

If you are new, or just looking for guidance, here are some helpful links to get you started.

What are the benefits of VIP Membership?
VIP members get exclusive access to these proven and tested premium indicators: Buy the Dip, Advanced Market Moves 2.0, Take Profit, and Volatility Trading Range. In addition, VIP members get access to over 50 VIP-only custom indicators, add-ons, and strategies, private VIP-only forums, private Discord channel to discuss trades and strategies in real-time, customer support, trade alerts, and much more. Learn all about VIP membership here.
How can I access the premium indicators?
To access the premium indicators, which are plug and play ready, sign up for VIP membership here.
Back
Top