For a multi-day, intra-day chart, such as 5-90 day, 5-min to 4-hour chart, I want to start a trendline at a certain Date/Time (associated with a bar start time) and end at another Date/Time.
I’ve done trendlines like this for a single day, such as a 5-min chart. I can control which day (out of the last X days) and which time the plot begins and ends. By referencing the Day and the Session Start time, I convert times to a bar count and count bars based on GetAggregationPeriod(). So, this works whatever bar time increment (aggregation) I choose. The attached chart has a curving trendline on 6/18/26.
I’ve also written code like this for daily charts to increment* the trendline based on calendar days, starting on a particular date, but that results in a big jump on Mondays (and even more on 3-day weekends). This is not good. I am aware of CountTradingDays(fromDate, toDate), but I had trouble calculating a toDate (an input toDate worked, but not a calculated value, even using GetYYYYMMDD()). But, this is not necessary if barnumbers are used.
(*The values are actually a ratio times the beginning value.)
For multi-day, intra-day charts, it seems the best way is to use barnumbers. Then I can calculate an incremental* change per bar and I won’t have to worry about holidays either. I’ve been able to plot simple barnumber() on a lower chart. But, I need to set the start of the trendline to a barnumber to equate to zero for calculation purposes. Conceptually this is easily done by identifying the barnumber of the start Date/Time. But, how to do that?
I have found an example of using GetValue(barnumber(), offset) in
https://usethinkscript.com/threads/xstream-regime-bands-for-thinkorswim.22196/
and an example of GetValue(len[gth]), i) and GetValue(GetTime(), i) in
https://usethinkscript.com/threads/...-relative-volume-indicator.20284/#post-149345
I’m not sure how to create an offset (to find the barnumber) based on an input Date/Time for starting and ending the trendline. So, I need help here. I appreciate anything you can provide. I don’t need the whole code, just the snippet of how to reference the barnumber for a certain date/time similar to those referenced above.
And, this needs to work if I change the chart interval from 90 days to 30 days, which will cause the barnumbers to change, but not the begin and end date/time.
In the attached chart, my end-of-day time is 1400 because I’m in the Mountain Time zone.
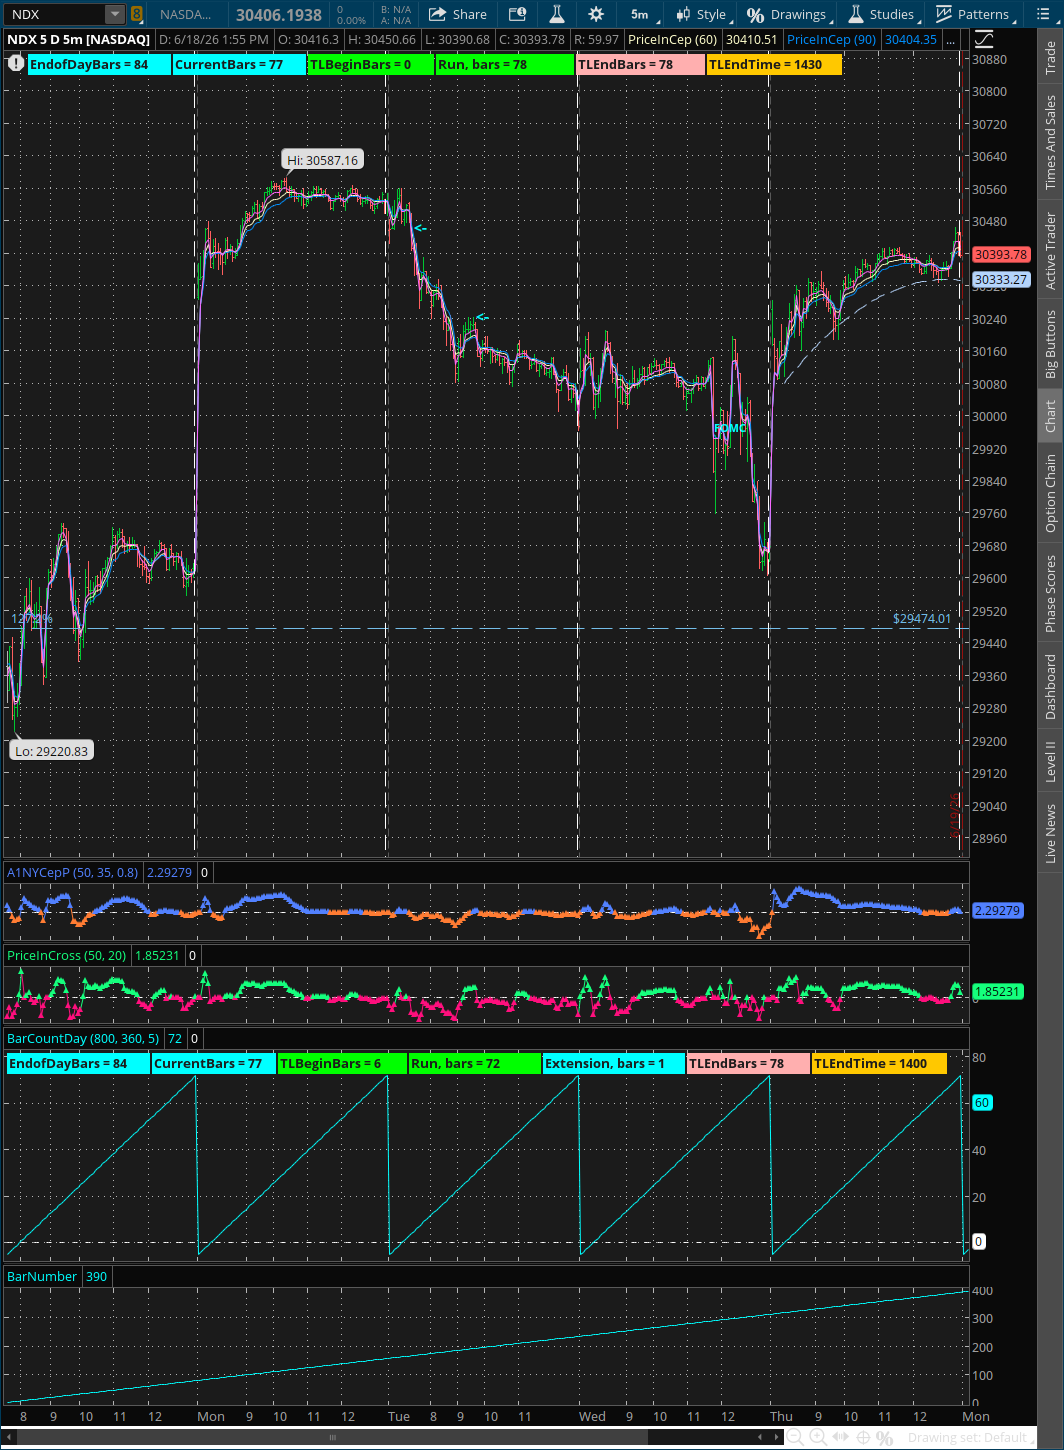
I’ve done trendlines like this for a single day, such as a 5-min chart. I can control which day (out of the last X days) and which time the plot begins and ends. By referencing the Day and the Session Start time, I convert times to a bar count and count bars based on GetAggregationPeriod(). So, this works whatever bar time increment (aggregation) I choose. The attached chart has a curving trendline on 6/18/26.
I’ve also written code like this for daily charts to increment* the trendline based on calendar days, starting on a particular date, but that results in a big jump on Mondays (and even more on 3-day weekends). This is not good. I am aware of CountTradingDays(fromDate, toDate), but I had trouble calculating a toDate (an input toDate worked, but not a calculated value, even using GetYYYYMMDD()). But, this is not necessary if barnumbers are used.
(*The values are actually a ratio times the beginning value.)
For multi-day, intra-day charts, it seems the best way is to use barnumbers. Then I can calculate an incremental* change per bar and I won’t have to worry about holidays either. I’ve been able to plot simple barnumber() on a lower chart. But, I need to set the start of the trendline to a barnumber to equate to zero for calculation purposes. Conceptually this is easily done by identifying the barnumber of the start Date/Time. But, how to do that?
I have found an example of using GetValue(barnumber(), offset) in
https://usethinkscript.com/threads/xstream-regime-bands-for-thinkorswim.22196/
and an example of GetValue(len[gth]), i) and GetValue(GetTime(), i) in
https://usethinkscript.com/threads/...-relative-volume-indicator.20284/#post-149345
I’m not sure how to create an offset (to find the barnumber) based on an input Date/Time for starting and ending the trendline. So, I need help here. I appreciate anything you can provide. I don’t need the whole code, just the snippet of how to reference the barnumber for a certain date/time similar to those referenced above.
And, this needs to work if I change the chart interval from 90 days to 30 days, which will cause the barnumbers to change, but not the begin and end date/time.
In the attached chart, my end-of-day time is 1400 because I’m in the Mountain Time zone.