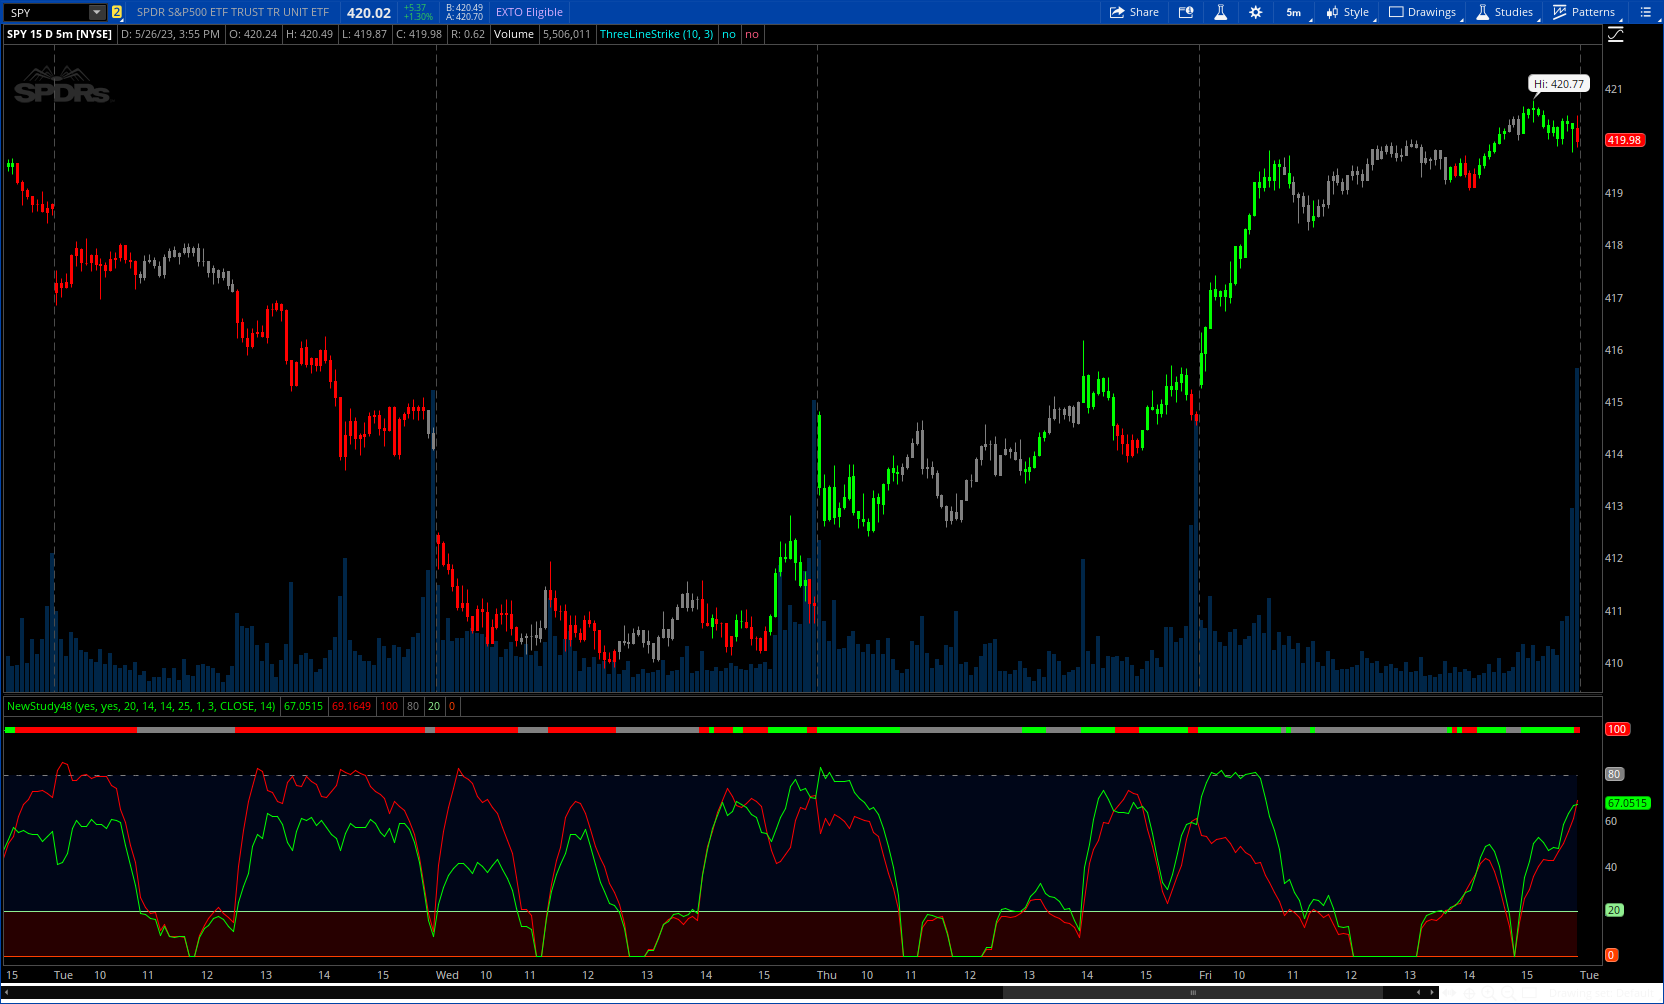
The True Trend oscillator identifies trending or ranging markets with a stochastic ATR and RSI.
CODE:
CSS:
#// This source code is subject to the terms of the Mozilla Public License 2.0 at https://mozilla.org/MPL/2.0/
#// © wbburgin
#indicator("True Trend Oscillator [wbburgin]",overlay=false)
# converted and mod by Sam2Cok@Samer800    - 05/2023
declare lower;

input colorBars = yes;
input ShowTrendLinw = yes;
input RangeThreshold = 20;     # "A higher threshold will identify more ranges but will be slower at catching the trend"
input atrLength = 14;          # "ATR Length"
input lengthStoch = 14;        # "Stochastic Length"
input Lookback = 25;           # "The number of bars used for the estimation of the rational quadratic kernel"
input RelativeWeighting = 1;   # "Relative Weighting"
input StochasticSmoothing = 3; # "Stochastic Smoothing"
input rsiSource = close;       # "RSI Source"
input rsiLength = 14;          # "RSI Length"

def na = Double.NaN;
def last = isNaN(close);
def threshold = min(max(RangeThreshold, 0), 100);
#stochatr(src,smoothK,lookback,weighting,lengthStoch)=>
script stochatr {
    input atrSrc = 1;
    input smoothK = 3;
    input lookback = 25;
    input weighting = 1;
    input lengthStoch = 14;
    def lowest_k = Lowest(atrSrc, lengthStoch);
    def c1 = atrSrc - lowest_k;
    def c2 = Highest(atrSrc, lengthStoch) - lowest_k;
    def fastK = if c2 != 0 then c1 / c2 * 100 else 0;
    def _src = fastK;
    def size = smoothK-1;
    def currentWeight    = fold i = 0 to size + smoothK with p do
                         p + _src[i] * Power(1 + (Power(i, 2) / ((Power(lookback, 2) * 2 * weighting))), - weighting);
    def cumulativeWeight = fold j = 0 to size + smoothK with q do
                         q +  Power(1 + (Power(j, 2) / ((Power(lookback, 2) * 2 * weighting))), - weighting);
    def yhat = currentWeight / cumulativeWeight;
    plot out = yhat;

}
def tr = TrueRange(high, close, low);
def atrSrc = WildersAverage(tr, atrLength);
def k = stochatr(atrSrc, StochasticSmoothing, Lookback, RelativeWeighting, lengthStoch);
def nRSI = RSI(Price = rsiSource, Length = rsiLength);
def bull = Sqrt(nRSI * k);
def bear = Sqrt((100 - nRSI) * k);
def dir = min(bull,bear);
def col = if (bull > bear and dir > threshold) then 1 else
          if (bear > bull and dir > threshold) then -1 else 0;

plot bullTrend = bull;    # "Bull Trend"
plot bearTrend = bear;    # "Bear Trend"
bullTrend.SetDefaultColor(Color.GREEN);
bearTrend.SetDefaultColor(Color.RED);

plot trend = if last or !ShowTrendLinw then na else 100;
plot top = if last then na else 80;#
plot bottom = if last then na else threshold;
plot base = if last then na else 0;
trend.AssignValueColor(if col>0 then Color.GREEN else if col<0 then Color.RED else Color.GRAY);
trend.SetPaintingStrategy(PaintingStrategy.LINE_VS_SQUARES);
bottom.SetDefaultColor(Color.LIGHT_GREEN);
base.SetDefaultColor(Color.LIGHT_RED);
top.SetStyle(Curve.SHORT_DASH);
top.SetDefaultColor(Color.GRAY);

#-- cloud and BarColor
AddCloud(top, bottom, CreateColor(0, 21, 80), CreateColor(0, 21, 80));
AddCloud(bottom, base, Color.DARK_RED, Color.DARK_RED);

AssignPriceColor(if !colorBars then Color.CURRENT else
                 if col>0 then Color.GREEN else if col<0 then Color.RED else Color.GRAY);


#-- END of CODE
