True Center Band Indicator for ThinkorSwim

germanburrito

Active member
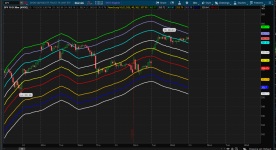
This is my version of the true center band indicator. you guys have been great to me. Improvements are encouraged and welcome.

Code:
input price = close;
input length = 40;
def displacement = (length);
def dPrice = price[displacement];
def tmp = if !IsNaN(dPrice) then Average(dPrice, AbsValue(length)) else tmp[1] + (tmp[1] - tmp
[2]);
def tmp1 = if !IsNaN(price) then tmp else Double.NaN;
plot Data = tmp1;
Data.SetDefaultColor(color.yellow );

def pct=100;
input width=50;
def d=width/pct;
def d1=2*d;
def d25=1.07*d;
def d2=1.15*d;
def d3=1.618*d;
def d4=.47*d;

def stdDeviation = Highestall("data" = AbsValue(tmp1 - price));
plot UpperLine = tmp1 + stdDeviation*d1;
plot LowerLine = tmp1 - stdDeviation*d1;
plot UpperLine1 = tmp1 + stdDeviation*d25;
plot LowerLine1 = tmp1 - stdDeviation*d2;
plot UpperLine2 = tmp1 + stdDeviation*d3;
plot LowerLine2 = tmp1 - stdDeviation*d3;
plot UpperLine4 = tmp1 + stdDeviation*d4;
plot LowerLine4 = tmp1 - stdDeviation*d4;
UpperLine.SetDefaultColor(color.Green);
UpperLine1.SetDefaultColor(color.cyan);
UpperLine2.SetDefaultColor(color.violet);
LowerLine.SetDefaultColor(color.white );
LowerLine1.SetDefaultColor(color.orange );
LowerLine2.SetDefaultColor(color.blue );
LowerLine4.SetDefaultColor(color.light_RED );
LowerLine4.SetDefaultColor(color.red );
data.setDefaultColor(color.YEllow);

upperline.SetLineWeight(2);
upperline1.SetLineWeight(2);
upperline2.SetLineWeight(2);
upperline4.SetLineWeight(2);
upperline.SetLineWeight(2);
lowerLine.setlineweight(2);
lowerLine1.setlineweight(2);
lowerLine2.setlineweight(2);
lowerLine4.setlineweight(2);
Data.setlineweight(2);

Ks1HDQK.png
Pwj2ekm.png
 

Attachments

  • Ks1HDQK.png
    Ks1HDQK.png
    385.3 KB · Views: 196
Last edited by a moderator:

Join useThinkScript to post your question to a community of 21,000+ developers and traders.

Hello German,

I have changed the colors of your bands to reflect Murrey Math colors, and I have added Clouds

Code:
###############

input price = close;
input length = 40;
def displacement = (length);
def dPrice = price[displacement];
def tmp = if !IsNaN(dPrice) then Average(dPrice, AbsValue(length)) else tmp[1] + (tmp[1] - tmp
[2]);
def tmp1 = if !IsNaN(price) then tmp else Double.NaN;
plot Data = tmp1;
Data.SetDefaultColor(color.yellow );

def pct=100;
input width=50;
def d=width/pct;
def d1=2*d;
def d25=1.07*d;
def d2=1.15*d;
def d3=1.618*d;
def d4=.47*d;

def stdDeviation = Highestall("data" = AbsValue(tmp1 - price));
plot UpperLine = tmp1 + stdDeviation*d1;
plot LowerLine = tmp1 - stdDeviation*d1;
plot UpperLine1 = tmp1 + stdDeviation*d25;
plot LowerLine1 = tmp1 - stdDeviation*d2;
plot UpperLine2 = tmp1 + stdDeviation*d3;
plot LowerLine2 = tmp1 - stdDeviation*d3;
plot UpperLine4 = tmp1 + stdDeviation*d4;
plot LowerLine4 = tmp1 - stdDeviation*d4;
UpperLine.SetDefaultColor(color.Blue);
UpperLine1.SetDefaultColor(color.Red);
UpperLine2.SetDefaultColor(color.Yellow);
LowerLine.SetDefaultColor(color.Blue);
LowerLine1.SetDefaultColor(color.Red);
LowerLine2.SetDefaultColor(color.Yellow );
LowerLine4.SetDefaultColor(color.Green);
UpperLine4.SetDefaultColor(color.Green);
data.setDefaultColor(color.Blue);

upperline.SetLineWeight(2);
upperline1.SetLineWeight(2);
upperline2.SetLineWeight(2);
upperline4.SetLineWeight(2);
upperline.SetLineWeight(2);
lowerLine.setlineweight(2);
lowerLine1.setlineweight(2);
lowerLine2.setlineweight(2);
lowerLine4.setlineweight(2);

Data.setlineweight(2);

AddCloud(Upperline, Upperline2, Color.Pink, Color.Pink, no);
AddCloud(Upperline1, Upperline4, Color.pink, Color.Pink, no);
AddCloud(Lowerline4, Lowerline1, Color.LIme, Color.Lime, no);
AddCloud(Lowerline2, Lowerline, Color.Lime, Color.Lime, no);

Here is what I find that I don't like about this indicator, It bends with price. It doesn't have a backbone where price hits a firm resistance or support level. A trailing stop never backs down from price, it attacks price, till proven wrong. Just my opinion!
 
@henry1224 it does bend with price and also when resistnce hits the outter bands it will repaint, but its a cool idea, it pushes pass price into the future to see price levels and the inner bands usually are very true to price, it helps me dictate, its not bending entirely with current price but with pass price.

also i wouldnt use the blue band its too many bands, the bands are supost to be fibonacci ratios.
 
Is there a scan that can be set up to scan for the lower band (white). I've found this to be quite interesting...
 

Similar threads

Not the exact question you're looking for?

Start a new thread and receive assistance from our community.

87k+ Posts
480 Online
Create Post

Similar threads

Similar threads

The Market Trading Game Changer

Join 2,500+ subscribers inside the useThinkScript VIP Membership Club
  • Exclusive indicators
  • Proven strategies & setups
  • Private Discord community
  • ‘Buy The Dip’ signal alerts
  • Exclusive members-only content
  • Add-ons and resources
  • 1 full year of unlimited support

Frequently Asked Questions

What is useThinkScript?

useThinkScript is the #1 community of stock market investors using indicators and other tools to power their trading strategies. Traders of all skill levels use our forums to learn about scripting and indicators, help each other, and discover new ways to gain an edge in the markets.

How do I get started?

We get it. Our forum can be intimidating, if not overwhelming. With thousands of topics, tens of thousands of posts, our community has created an incredibly deep knowledge base for stock traders. No one can ever exhaust every resource provided on our site.

If you are new, or just looking for guidance, here are some helpful links to get you started.

What are the benefits of VIP Membership?
VIP members get exclusive access to these proven and tested premium indicators: Buy the Dip, Advanced Market Moves 2.0, Take Profit, and Volatility Trading Range. In addition, VIP members get access to over 50 VIP-only custom indicators, add-ons, and strategies, private VIP-only forums, private Discord channel to discuss trades and strategies in real-time, customer support, trade alerts, and much more. Learn all about VIP membership here.
How can I access the premium indicators?
To access the premium indicators, which are plug and play ready, sign up for VIP membership here.
Back
Top