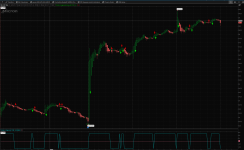
The indicator was made my Mobius. This indicator can predict bullish and bearish trend by plotting lines between 0.2 to -0.2 graph. If the line is at 0.2(Positive) than its trending if it's at -0.2(negative) then its bearish.
Originally it was made as a lower study. I modified it and made it upper study with arrows when bullish and bearish patterns appear. This will save some space on the workspace for other indicators.
I have done some backtesting and it generated some decent amount on profits on Timeframes above 3 Minutes.
Cons: Does not work well in Choppy Markets.
thinkScript Code
Code:
# R Signal Trend Sign

#Mobius

#If R signal is above 0 trend is up and below 0 trend is down.

#V01.06.01.2019

#Modified: Jerry 6/27/2019

input n = 10;
def size = 100;

def c = close;

def r = Sqrt(Sqr(Log(c / c[n])) + Sqr(Log(n))) /

        Sum(Sqrt(1 + Sqr(Log(c / c[1]))), n - 1);

def signal = if Log(c / c[n]) > 0 then ExpAverage(r, n) else ExpAverage(-r, n);

AddLabel(yes, signal, Color.WHITE);
def buy = 0;
def sell = 0;
def strategy = if signal > 0 then buy else if signal < 0 then sell else 0;

plot buyOpen = signal[1] crosses above 0;
buyOpen.AssignValueColor(Color.GREEN);
buyOpen.SetPaintingStrategy(PaintingStrategy.BOOLEAN_ARROW_UP);
def buyClose = signal crosses below 0;

plot shortOpen = signal[1] crosses below 0;
shortOpen.AssignValueColor(Color.RED);
shortOpen.SetPaintingStrategy(PaintingStrategy.BOOLEAN_ARROW_DOWN);
def shortClose = signal crosses above 0;
Shareable Link
Upper Study: https://tos.mx/dfQoeALower Study: https://tos.mx/WipD1UAttachments
Last edited by a moderator:

