
Author Message:
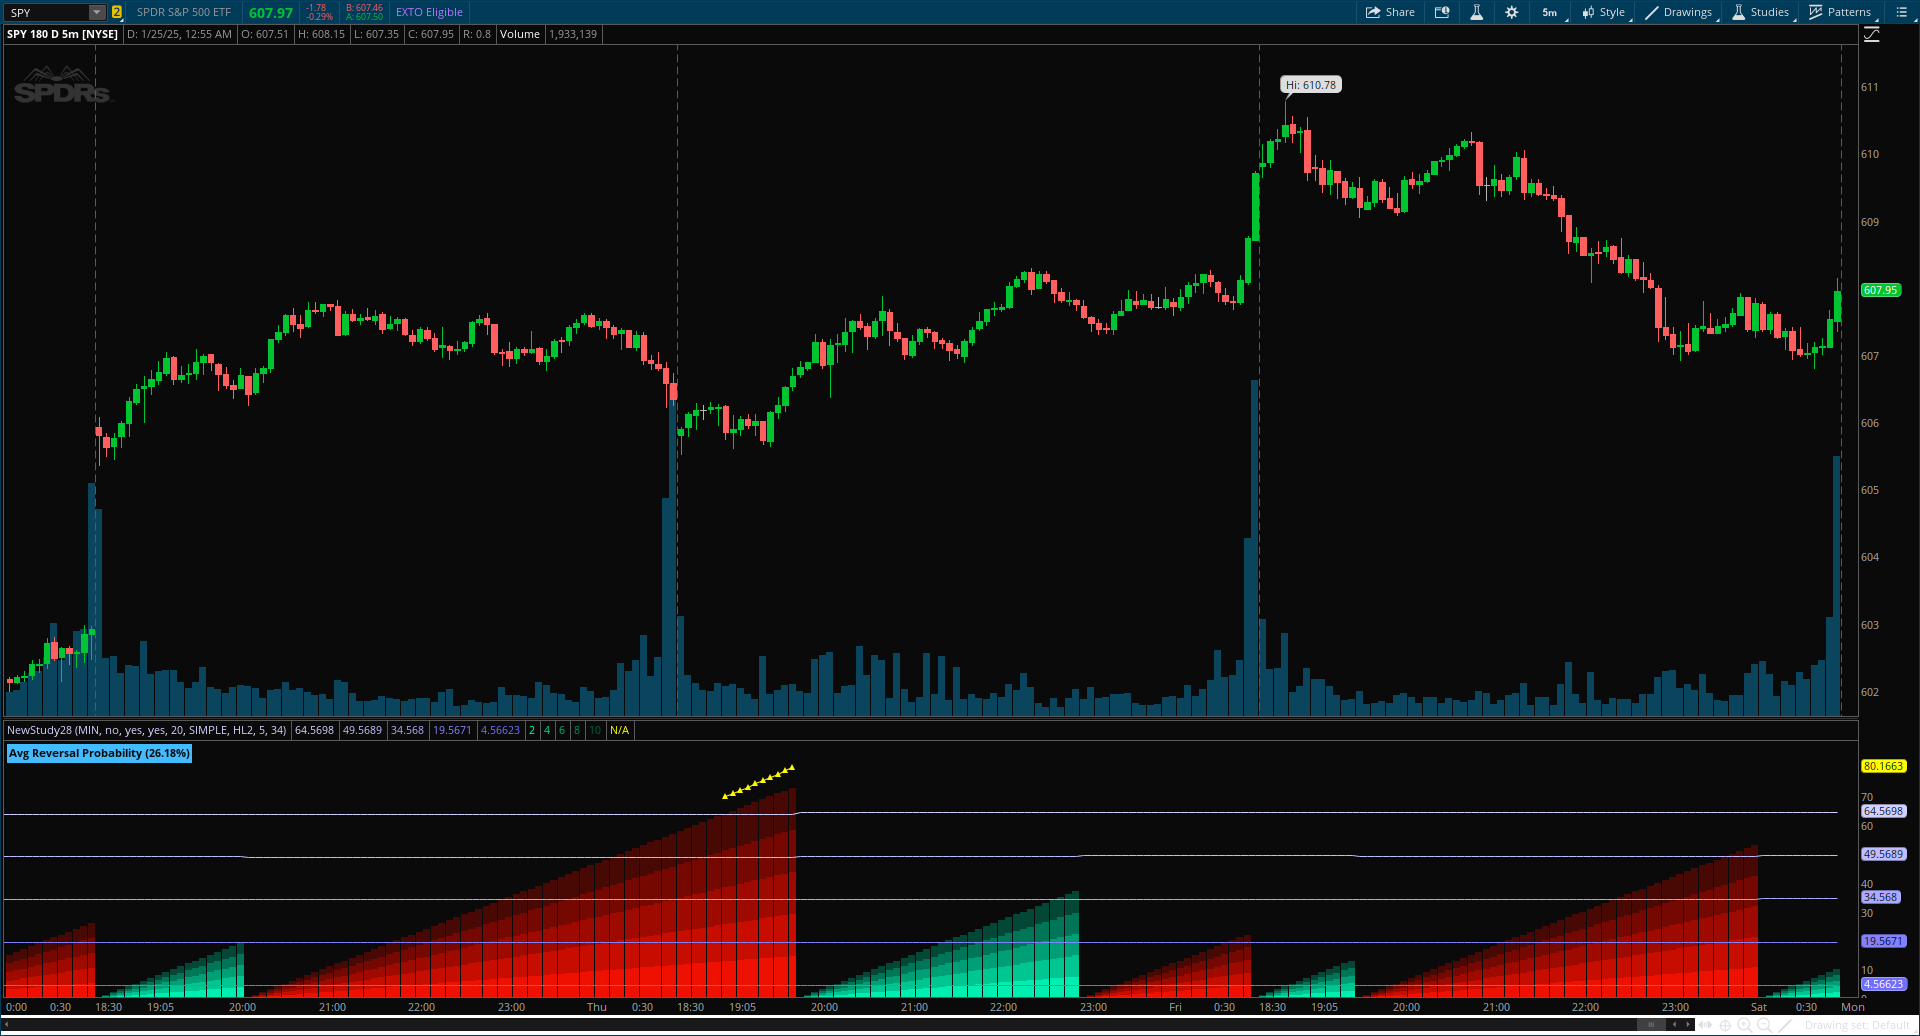
Trend Reversal Probability by AlgoAlpha – a powerful indicator that estimates the likelihood of trend reversals based on an advanced custom oscillator and duration-based statistics. Designed for traders who want to stay ahead of potential market shifts, this indicator provides actionable insights into trend momentum and reversal probabilities.
More Details: https://www.tradingview.com/v/7gnQovYe/
CODE:
CSS:
#// Indicator for TOS
#//@Algoalpha
#indicator("Trend Reversal Probability [Algoalpha]", "AlgoAlpha - Trend Reversal"
# Converted by Sam4Cok@Samer800

declare zerobase;
Declare lower;

input timeframe = AggregationPeriod.MIN;
input colorBars = no;
input showProbabilityLabel = yes;
input EnableProbabilityLevels = yes;  # "Enable Probability Levels"
input rsiLength = 20;          # "Oscillator Length"
input movAvgType = AverageType.SIMPLE;
input source = FundamentalType.HL2;
input fastLength = 5;
input slowLength = 34;

def na = Double.NaN;
def last = isNaN(Close);
def cap = GetAggregationPeriod();
def tf = Max(cap, timeframe);
def src = Fundamental(source, Period = tf);

#--
DefineGlobalColor("Green1" , CreateColor(0, 255, 187));
DefineGlobalColor("Green2" , CreateColor(0, 216, 158));
DefineGlobalColor("Green3" , CreateColor(0, 177, 129));
DefineGlobalColor("Green4" , CreateColor(0, 137, 101));
DefineGlobalColor("Green5" , CreateColor(0, 98, 72));
DefineGlobalColor("Red1" , CreateColor(255, 17, 0));
DefineGlobalColor("Red2" , CreateColor(216, 14, 0));
DefineGlobalColor("Red3" , CreateColor(177, 12, 0));
DefineGlobalColor("Red4" , CreateColor(137, 9, 0));
DefineGlobalColor("Red5" , CreateColor(98, 7, 0));

DefineGlobalColor("dev1" , CreateColor(209, 209, 255));
DefineGlobalColor("dev2" , CreateColor(189, 189, 255));
DefineGlobalColor("dev3" , CreateColor(170, 170, 255));
DefineGlobalColor("dev4" , CreateColor(130, 130, 255));
DefineGlobalColor("dev5" , CreateColor(111, 111, 255));
#// Amazing Oscillator Calculation
def shortSMA = MovingAverage(movAvgType, src, fastLength);
def longSMA  = MovingAverage(movAvgType, src, slowLength);
def amazingOsc = shortSMA - longSMA;
#// RSI-like Calculation
def cRSI = rsi(Price = amazingOsc, Length = rsiLength);
def customRSI = cRSI - 50;
def col = customRSI > 0;
def cross = if (customRSI > 0 and customRSI[1] <= 0) then yes else
            if (customRSI < 0 and customRSI[1] >= 0) then yes else no;
def cut = if cross then 0 else cut[1] + 1;
def volatility = stdev(cut, 100) / 3;
def cutCnt;
def cutVal;
def sqrVal;
if (cut == 0 and cut[1]) {
    cutCnt = cutCnt[1] + 1;
    cutVal = cutVal[1] + cut[1];
    sqrVal = sqrVal[1] + Sqr(cut[1]);
    } else {
    cutCnt = cutCnt[1];
    cutVal = cutVal[1];
    sqrVal = sqrVal[1];
}
def avg  = if cutCnt!=0 then cutVal / cutCnt else na;
def StDv = if cutCnt!=0 then Sqrt((sqrVal / cutCnt) - Sqr(avg)) else na;
def up3 = avg + StDv * 3;
def up2 = avg + StDv * 2;
def up1 = avg + StDv * 1;
def lo1 = avg - StDv * 1;
def chg1 = cut * 0.80;
def chg2 = cut * 0.60;
def chg3 = cut * 0.40;
def chg4 = cut * 0.20;

plot upper3 = if !last and EnableProbabilityLevels then up3 else na;  # "Upper 3 SD"
plot upper2 = if !last and EnableProbabilityLevels then up2 else na;  # "Upper 2 SD"
plot upper1 = if !last and EnableProbabilityLevels then up1 else na;
plot basis  = if !last and EnableProbabilityLevels then avg else na;
plot lower1 = if !last and EnableProbabilityLevels then lo1 else na;      # "Lower 1 SD"

plot sigDuration5 = if last then na else chg4; # "Signal Duration 20%"
plot sigDuration4 = if last then na else chg3; # "Signal Duration 40%"
plot sigDuration3 = if last then na else chg2; # "Signal Duration 60%"
plot sigDuration2 = if last then na else chg1; # "Signal Duration 80%"
plot sigDuration1 = if last then na else cut;  # "Signal Duration"

upper3.SetDefaultColor(GlobalColor("dev1"));
upper2.SetDefaultColor(GlobalColor("dev2"));
upper1.SetDefaultColor(GlobalColor("dev3"));
basis.SetDefaultColor(GlobalColor("dev4"));
lower1.SetDefaultColor(GlobalColor("dev5"));

sigDuration1.SetPaintingStrategy(PaintingStrategy.SQUARED_HISTOGRAM);
sigDuration2.SetPaintingStrategy(PaintingStrategy.SQUARED_HISTOGRAM);
sigDuration3.SetPaintingStrategy(PaintingStrategy.SQUARED_HISTOGRAM);
sigDuration4.SetPaintingStrategy(PaintingStrategy.SQUARED_HISTOGRAM);
sigDuration5.SetPaintingStrategy(PaintingStrategy.SQUARED_HISTOGRAM);

sigDuration1.AssignValueColor(if col then GlobalColor("Green5") else GlobalColor("Red5"));
sigDuration2.AssignValueColor(if col then GlobalColor("Green4") else GlobalColor("Red4"));
sigDuration3.AssignValueColor(if col then GlobalColor("Green3") else GlobalColor("Red3"));
sigDuration4.AssignValueColor(if col then GlobalColor("Green2") else GlobalColor("Red2"));
sigDuration5.AssignValueColor(if col then GlobalColor("Green1") else GlobalColor("Red1"));

plot extreme = if cut > (avg + StDv * 3) then cut + volatility else na; # "Extreme Reversal Probability"
extreme.SetPaintingStrategy(PaintingStrategy.LINE_VS_TRIANGLES);
extreme.SetDefaultColor(Color.YELLOW);

#// Function to approximate cumulative probability using error function
Script f_cdf {
input z = 0;
    def a1 = 0.254829592;
    def a2 = -0.284496736;
    def a3 = 1.421413741;
    def a4 = -1.453152027;
    def a5 = 1.061405429;
    def p  = 0.3275911;
    def sign = if z < 0 then -1 else 1;
    def x = AbsValue(z) / sqrt(2);
    def t = 1 / (1 + p * x);
    def erf_approx = 1 - (((((a5 * t + a4) * t) + a3) * t + a2) * t + a1) * t * exp(-x * x);
    def f_cdf = 0.5 * (1 + sign * erf_approx);
    plot out = if isNaN(f_cdf) then 0 else Min(Max(f_cdf, 0), 1);
}
def z = (cut - avg) / StDv;
def probability = f_cdf(z);

def prop = probability * 100;


AddLabel(showProbabilityLabel,(if prop > up3 then "Extreme Reversal Probability (" else
                if prop > up2 then "Very High Reversal Probability (" else
                if prop > up1 then "High Reversal Probability (" else
                if prop > avg then "Avg Reversal Probability (" else
                if prop > lo1 then "Low Reversal Probability (" else "Very Low Reversal Probability (")  +
            AsPercent(probability) + ")", CreateColor(prop*2.55, 255 - prop*2.55, 255));

#-- Bar Color
##// ~~ Gradient Coloring {
Script gradient_color {
input src = close;
input minVal = 10;
input maxVal = 400;
input loR = 173;
input loG = 216;
input loB = 230;
input hiR = 41;
input hiG = 98;
input hiB = 255;
    def value = if isNaN(src) then 0 else src;
    def clamped_value = max(min(value, maxVal), minVal);
    def normalized_value = (clamped_value - minVal) / (maxVal - minVal);
    def re = floor(loR + (hiR - loR) * normalized_value);
    def gr = floor(loG + (hiG - loG) * normalized_value);
    def bl = floor(loB + (hiB - loB) * normalized_value);
    plot r = re;
    plot g = gr;
    plot b = bl;
}

def r = gradient_color(cut,  avg - StDv * 2, up2, 0, 255, 0, 255, 0, 0).r;


AssignPriceColor(if !colorBars then Color.CURRENT else
                 if col > 0 then CreateColor(0, r, r) else
                                 CreateColor(r, 0, r));
#AssignPriceColor(if !colorBars then Color.CURRENT else CreateColor(255 - cRSI*2.55, cRSI*2.55, cRSI*2.55));

#-- END of CODe