Author Message:
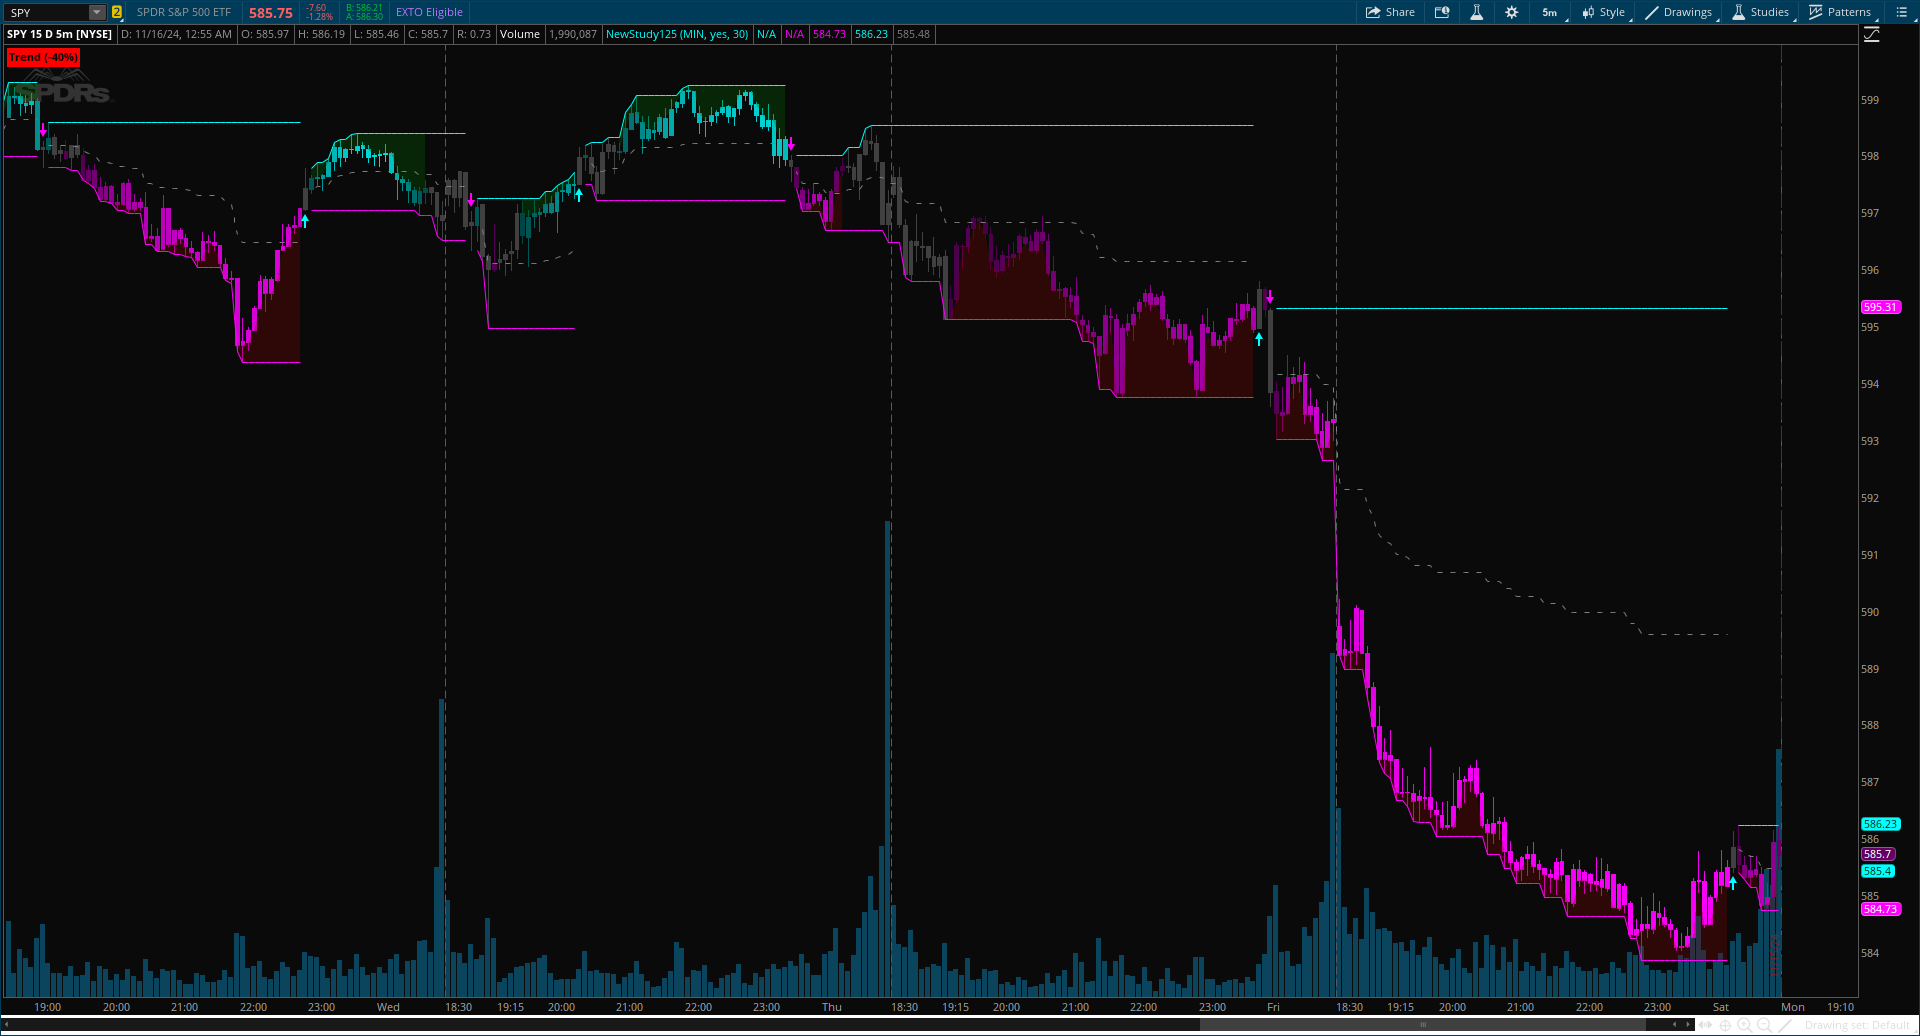
The Trend Levels [ChartPrime] indicator is designed to identify key trend levels (High, Mid, and Low) during market trends, based on real-time calculations of highest, lowest, and mid-level values over a customizable length. Additionally, the indicator calculates trend strength by measuring the ratio of candles closing above or below the midline, providing a clear view of the ongoing trend dynamics and strength.
CODE:
CSS:
# Indicator for TOS
#// © ChartPrime
#indicator("Trend Levels [ChartPrime]", overlay = true, max_labels_count = 500)
# Converted by Sam4Cok@Samer800    - 11/2024

input timeframe = AggregationPeriod.MIN;
input colorBars = yes;
input length = 30;


def na = Double.NaN;
def last = IsNaN(close);
def current = GetAggregationPeriod();
def tf = Max(current, timeframe);
#-- Color
DefineGlobalColor("up", Color.CYAN);
DefineGlobalColor("dn", Color.MAGENTA);
#// 𝙄𝙉𝘿𝙄𝘾𝘼𝙏𝙊𝙍 𝘾𝘼𝙇𝘾𝙐𝙇𝘼𝙏𝙄𝙊𝙉𝙎
#// Calculate highest and lowest over the specified length
def h = Highest(high(Period = tf), length);
def l = Lowest(low(Period = tf), length);
#// Determine trend direction: if the current high is the highest value, set trend to true
def trend;
if h == high(Period = tf) {
    trend = yes;
#// If the current low is the lowest value, set trend to false
} else if l == low(Period = tf) {
    trend = no;
} else {
    trend = trend[1];
}
def change = trend - trend[1];
def bars = if change then 1 else if !trend then bars[1] + 1 else if trend then bars[1] + 1 else bars[1];

#// Calculate highest, lowest, and mid-level values based on the number of bars
def h11 = fold i = 0 to bars with p = high(Period = tf) do
         Max(p, GetValue(high(Period = tf), i));
def l11 = fold j = 0 to bars with q = low(Period = tf) do
         Min(q, GetValue(low(Period = tf), j));
def m11 = (h11 + l11) / 2;
def h1; def l1; def m1;
if bars == 1 {
    h1 = na;
    l1 = na;
    m1 = na;
} else {
    h1 = h11;
    l1 = l11;
    m1 = m11;
}
#// Update counters for up and down closes based on the mid-level value
def count_up = if isNaN(m1) then 1 else if close(Period = tf) > m1 then count_up[1] + 1 else count_up[1];
def count_dn = if isNaN(m1) then 1 else if close(Period = tf) < m1 then count_dn[1] + 1 else count_dn[1];

#// Calculate the delta percentage between up and down counts
def total         = count_up + count_dn;
def delta_percent = (count_up - count_dn) / total;
def col = if isNaN(delta_percent) then 0 else AbsValue(delta_percent) * 255;

#// Plot the high, low, and mid levels as lines
plot sigUp = if (trend and !trend[1]) then low else na;
plot sigDn = if (trend[1] and !trend) then high else na;
plot pl = if l1 then l1 else na;
plot ph = if h1 then h1 else na;
plot pm = if m1 then m1 else na;

sigUp.SetPaintingStrategy(PaintingStrategy.BOOLEAN_ARROW_UP);
sigDn.SetPaintingStrategy(PaintingStrategy.BOOLEAN_ARROW_DOWN);
sigUp.SetDefaultColor(GlobalColor("up"));
sigDn.SetDefaultColor(GlobalColor("dn"));
pm.SetStyle(Curve.SHORT_DASH);
ph.SetDefaultColor(GlobalColor("up"));
pl.SetDefaultColor(GlobalColor("dn"));
pm.SetDefaultColor(Color.GRAY);

#-- Cloud

AddCloud(if delta_percent > 0.25 then ph else na, Max(open, close), Color.DARK_GREEN);
AddCloud(if delta_percent < -0.25 then Min(open, close) else na, pl, Color.DARK_RED);

#-- Label
AddLabel(1, "Trend (" + AsPercent(delta_percent) + ")", if delta_percent>0 then Color.GREEN else Color.RED);

#-- Bar Color
AssignPriceColor(if !colorBars then Color.CURRENT else
                 if delta_percent > 0.25 then CreateColor(0, col, col) else
                 if delta_percent < -0.25 then CreateColor(col, 0, col) else Color.DARK_GRAY);

#-- END of CODE