john6peter
New member
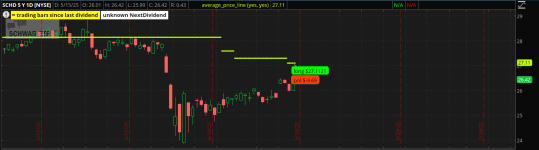
I was wondering if anyone knows how to show trade positions is a horizontal line in TOS the way ninjatrader does (see image). I tried using some basic scripting but it's beyond my abilities. Any help would be appreciated.

| Thread starter | Similar threads | Forum | Replies | Date |
|---|---|---|---|---|
|
|
Swing Trade Scanner Based On Fibonoci Long and Short Setups | Questions | 7 | |
| G | One clean trade a day | Questions | 2 | |
| Q | trend line trade: has anyone seen script…… | Questions | 1 | |
| B | trade a generic/expired contract period with respect to Treasuries futures? | Questions | 3 | |
|
|
Custom script in the option trade grid | Questions | 3 |
useThinkScript is the #1 community of stock market investors using indicators and other tools to power their trading strategies. Traders of all skill levels use our forums to learn about scripting and indicators, help each other, and discover new ways to gain an edge in the markets.
We get it. Our forum can be intimidating, if not overwhelming. With thousands of topics, tens of thousands of posts, our community has created an incredibly deep knowledge base for stock traders. No one can ever exhaust every resource provided on our site.
If you are new, or just looking for guidance, here are some helpful links to get you started.