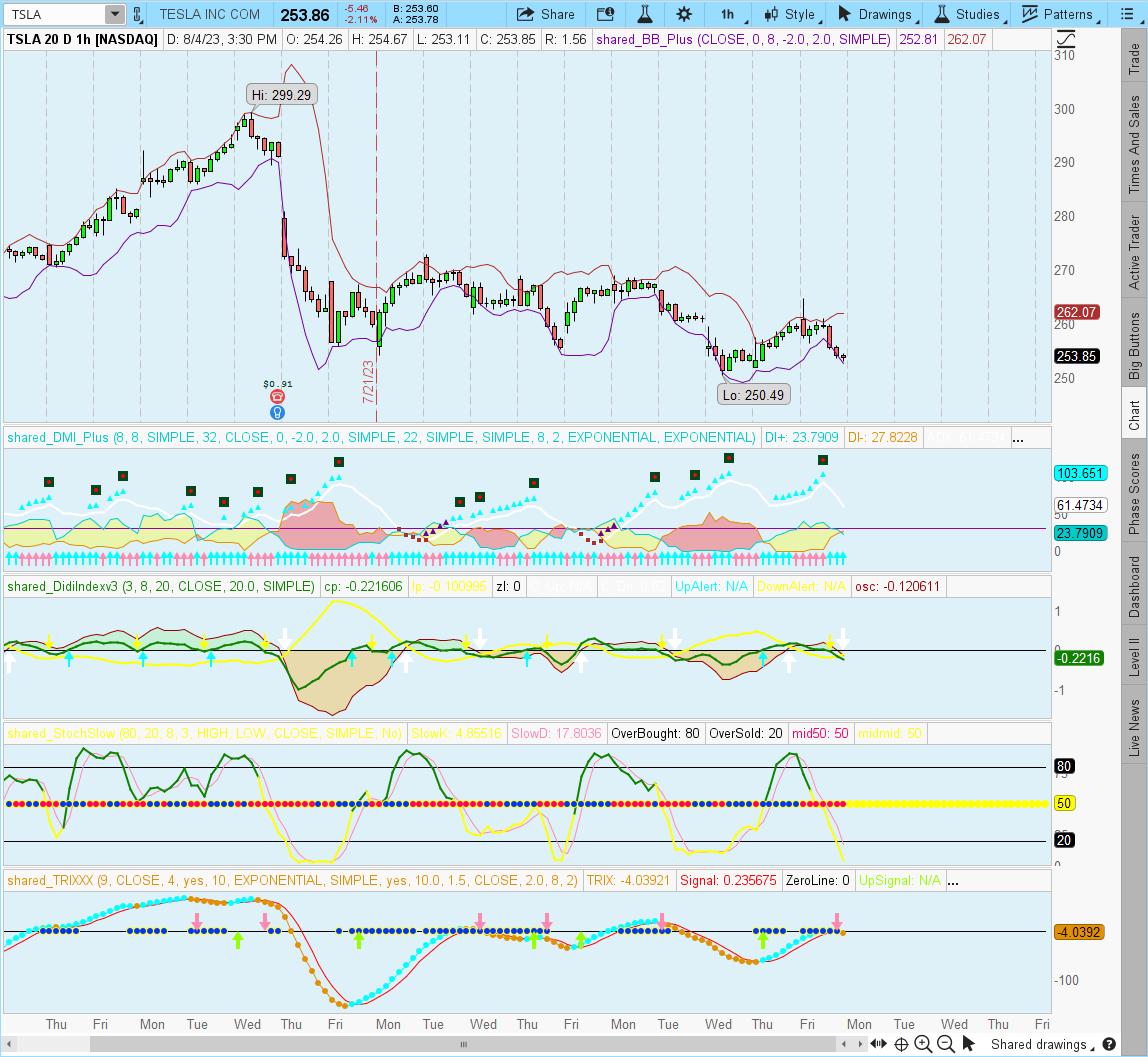
updated version here: https://usethinkscript.com/threads/...-didi-index-for-thinkorswim.4793/#post-123468
I found this Didi Index/Indicator. It seems Odir Aguiar (the Brazilian creator) flattened the 8 simple moving average and made it the "zero line" if I am not mistaken. I believe the picture below shows it
The idea is a stacked MA (thread) goes through the body of the same candle (Needle) including the wicks.
So for a bullish signal it would be: 3 above the 8 and 8 above the 20 and the inverse for a bearish move (if looking at it on the chart with the candles).
If the cross happens on the higher time frames (depending on the volume) it could take several days to trigger the move! From what I have noticed if the cross happens on the Daily, 4H, 1H it will take much longer to trigger, and sometimes even the 30M will take 2 days to move (pop), then the 15M and 5M, are more for intraday, but may fake you out.
He explains in one of his videos that he views the straight line as a fence separating 2 bulls (the other 2 MA`s) and when they run away from each other and there is a perfect cross, price runs big
The MA`s are 3 in blue, 8 in black and 20 in red.
He mentions in one of his videos that he also uses the DMI for trend confirmation and Bollinger Bands as well.
Pictures to illustrate it https://www.mql5.com/pt/code/1725
Didi_index (Lower Study)
I found this Didi Index/Indicator. It seems Odir Aguiar (the Brazilian creator) flattened the 8 simple moving average and made it the "zero line" if I am not mistaken. I believe the picture below shows it
The idea is a stacked MA (thread) goes through the body of the same candle (Needle) including the wicks.
So for a bullish signal it would be: 3 above the 8 and 8 above the 20 and the inverse for a bearish move (if looking at it on the chart with the candles).
If the cross happens on the higher time frames (depending on the volume) it could take several days to trigger the move! From what I have noticed if the cross happens on the Daily, 4H, 1H it will take much longer to trigger, and sometimes even the 30M will take 2 days to move (pop), then the 15M and 5M, are more for intraday, but may fake you out.
He explains in one of his videos that he views the straight line as a fence separating 2 bulls (the other 2 MA`s) and when they run away from each other and there is a perfect cross, price runs big
The MA`s are 3 in blue, 8 in black and 20 in red.
He mentions in one of his videos that he also uses the DMI for trend confirmation and Bollinger Bands as well.
Odir Aguiar
Indicator developed by the Brazilian and analyst Odir Aguiar (Didi), consists of "Moving Averages", famously known as "Didi needles", where it allows the viewing of reversal points.
The concept is very simple, when you enter 3 Moving Averages on display, a period equal to 3, one equal to 8 and the other equal to 20, then the formation of the indicator that works in axis or line center equal to 0 (zero) appears. ). Moving averages must intersect when approaching line 0.
Pictures to illustrate it https://www.mql5.com/pt/code/1725
Didi_index (Lower Study)
Code:
input price = close;
input short_length = 3;
input mid_length = 8;
input long_length = 20;

def sEMA = ExpAverage(price, short_length);
def mEMA = ExpAverage(price, mid_length);
def lEMA = ExpAverage(price, long_length);

plot s = sEMA / mEMA - 1;
plot l = lEMA / mEMA - 1;

s.AssignValueColor(Color.GREEN);
l.AssignValueColor(Color.MAGENTA);

plot zeroline = 0;
zeroline.AssignValueColor(Color.GRAY);
Last edited by a moderator:

