"Threaded Needle Cross" (Didi Index) alerts and MTF Scanner for TOS

Beltrame1

New member
VIP
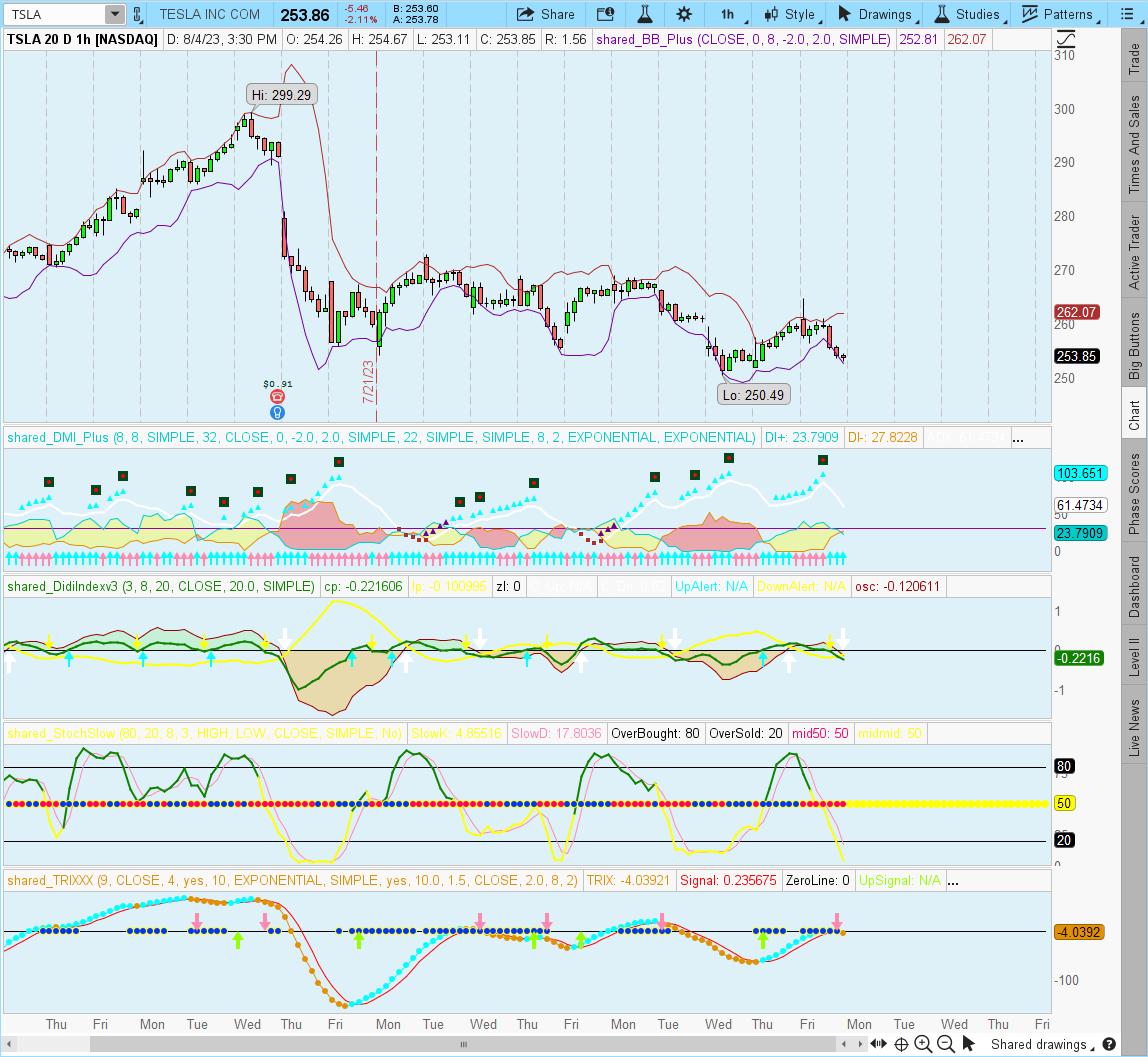
I found this Didi Index/Indicator. It seems Odir Aguiar (the Brazilian creator) flattened the 8 simple moving average and made it the "zero line" if I am not mistaken. I believe the picture below shows it and it would be AWESOME if when they CROSS PERFECTLY (or fairly close to perfect) to have some sort of sound alert or ARROW. The TOS code is below. The idea is a stacked MA (thread) goes through the body of the same candle (Needle) including the wicks.

So for a bullish signal it would be: 3 above the 8 and 8 above the 20 and the inverse for a bearish move (if looking at it on the chart with the candles).

If the cross happens on the higher time frames (depending on the volume) it could take several days to trigger the move! From what I have noticed if the cross happens on the Daily, 4H, 1H it will take much longer to trigger, and sometimes even the 30M will take 2 days to move (pop), then the 15M and 5M, are more for intraday, but may fake you out.

He explains in one of his videos that he views the straight line as a fence separating 2 bulls (the other 2 MA`s) and when they run away from each other and there is a perfect cross, price runs big @BenTen the MA`s are 3 in blue, 8 in black and 20 in red.

Also looking for a MTF Scanner for this perfect Threaded Needle Cross and if it is a long signal or a short signal... Thank you guys! He mentions in one of his videos that he also uses the DMI for trend confirmation and Bollinger Bands as well. Any and all ideas are welcome!!

Odir Aguiar

Indicator developed by the Brazilian and analyst Odir Aguiar (Didi), consists of "Moving Averages", famously known as "Didi needles", where it allows the viewing of reversal points.

The concept is very simple, when you enter 3 Moving Averages on display, a period equal to 3, one equal to 8 and the other equal to 20, then the formation of the indicator that works in axis or line center equal to 0 (zero) appears. ). Moving averages must intersect when approaching line 0.

Pictures to illustrate it https://www.mql5.com/pt/code/1725

Didi_index (Lower Study)

Code:
input price = close;
input short_length = 3;
input mid_length = 8;
input long_length = 20;

def sEMA = ExpAverage(price, short_length);
def mEMA = ExpAverage(price, mid_length);
def lEMA = ExpAverage(price, long_length);

plot s = sEMA / mEMA - 1;
plot l = lEMA / mEMA - 1;

s.AssignValueColor(Color.GREEN);
l.AssignValueColor(Color.MAGENTA);

plot zeroline = 0;
zeroline.AssignValueColor(Color.GRAY);
 
Last edited by a moderator:
@Beltrame1 I added Clouds

Code:
declare lower;
input price = close;
input short_length = 3;
input mid_length = 8;
input long_length = 20;

def sEMA = ExpAverage(price, short_length);
def mEMA = ExpAverage(price, mid_length);
def lEMA = ExpAverage(price, long_length);

plot s = sEMA / mEMA - 1;
plot l = lEMA / mEMA - 1;

s.AssignValueColor(Color.GREEN);
l.AssignValueColor(Color.MAGENTA);

plot zeroline = 0;
zeroline.AssignValueColor(Color.GRAY);
AddCloud(s,zeroline,Color.Green, color.yellow);
AddCloud(L,zeroline,Color.Magenta, color.yellow);
 
@Beltrame1 , here is a scanner when the S line crosses the L line, and viseversa:

Ruby:
declare lower;
input price = close;
input short_length = 3;
input mid_length = 8;
input long_length = 20;
input Show_Lines = yes;

def sEMA = ExpAverage(price, short_length);
def mEMA = ExpAverage(price, mid_length);
def lEMA = ExpAverage(price, long_length);

def S = sEMA / mEMA - 1;
def L = lEMA / mEMA - 1;

#s.AssignValueColor(Color.CYAN);
#l.AssignValueColor(Color.MAGENTA);

plot zeroline = 0;
zeroline.AssignValueColor(Color.GRAY);
#AddCloud(s,zeroline,Color.Green, color.yellow);
#AddCloud(L,zeroline,Color.Magenta, color.yellow);


#def Bullish =  if Show_Lines == yes then S crosses above L else no;
def Bullish = if S crosses above L then 1 else double.NaN;
plot UpArrow = Bullish;
UpArrow.SetPaintingStrategy(PaintingStrategy.BOOLEAN_ARROW_UP);
UpArrow.AssignValueColor(Color.CYAN);


#def Bearish =  if Show_Lines == yes then s crosses below l else no;
def Bearish = if S crosses below L then 1 else double.NaN;
plot DownArrow = Bearish;
DownArrow.SetPaintingStrategy(PaintingStrategy.BOOLEAN_ARROW_DOWN);
DownArrow.AssignValueColor(Color.MAGENTA);

So basically, the scan is identifying where the arrows are plotted:
wF7mu7j.png
 
@Beltrame1 The way that I get around with MTF and Scan. Follow along the steps :)

  1. Past the following Code into a Study, not in the ThinkScript Editor in Scan Tab.
  2. Go to Scan tab clear out all Filters.
  3. Add Study as a filter
  4. Go to thinkscript editor and past the following line
  5. EMAScan().Bull is true within 2 bars (for Bull case) or EMAScan().Bear is true within 2 bars (for Bear case)
  6. select a desired time frame, Say 15m checkbox on/off depends on when you scanning and your trading strategy.
  7. Repeat step 3 - 6, only select a different timeframe for each instance, for as many instances as you want.
  8. Hit Scan.

Have Fun.

PS: I haven't verified the indicators conditions, but I think got them right, and If I do, I think the original script has the "L" and "S" reversed.

Code:
#EMAScan
# SuryaKiranC : Scanner Created on Request

input price = close;
input short_length = 3;
input mid_length = 8;
input long_length = 20;

def sEMA = ExpAverage(price, short_length);
def mEMA = ExpAverage(price, mid_length);
def lEMA = ExpAverage(price, long_length);

def s = sEMA / mEMA - 1;
def l = lEMA / mEMA - 1;

def Bear = l > 0;
def Bull = s > 0;

plot scan = (Bull or Bear);

EMAScan
 
This indicator is just a tad bit off because the Didi Index uses RSI to determine Bullish and Bearish. I could be wrong though. Here is my interpretation of the indicator.

declare lower;
input price = close;
input short_length = 3;
input mid_length = 8;
input long_length = 20;

def sEMA = ExpAverage(price, short_length);
def mEMA = ExpAverage(price, mid_length);
def lEMA = ExpAverage(price, long_length);

plot s = sEMA / mEMA - 1;
plot l = lEMA / mEMA - 1;

s.AssignValueColor(Color.GREEN);
l.AssignValueColor(Color.MAGENTA);

plot zeroline = 0;
zeroline.AssignValueColor(Color.GRAY);
AddCloud(s,L,Color.Green, color.RED);


def R= RSI();

#def Bullish = if Show_Lines == yes then S crosses above L else no;
def Bullish = if S crosses above L and R > 50 then zeroline else double.NaN;
plot Up= Bullish;
Up.SetPaintingStrategy(PaintingStrategy.points);
Up.AssignValueColor(Color.CYAN);
Up.setlineWeight(3);


#def Bearish = if Show_Lines == yes then s crosses below l else no;
def Bearish = if S crosses below L and R < 50 then zeroline else double.NaN;
plot Down = Bearish;
Down.SetPaintingStrategy(PaintingStrategy.points);
Down.AssignValueColor(Color.MAGENTA);
Down.setlineWeight(3);
 
Last edited:
the original Didi Index is based in simple moving average of 3,8,20 periods. It is part of Didi trading system which is more complex, but in my experience, as complete a trading system you can get and quite precise (I took his course). It uses in addition to the Didi Index, BollingerBands(8,2,-2), ADX/DI(8),Stochastic(8,3) and Trix(9,4) and it has clear rules for entering and exiting (doesn't use volume). You can have a glimpse to his setup in www.agulhada.com when clicking on the specific timeframe it is pointing the needle. the only problem for many could be the language as it is in Portuguese but it is quite simple to understand. you will find many youtube videos on Didi system. attached is my chart (working process) of Didi setup
shared chart link: http://tos.mx/OLuPHGd
d5uqkun.png
 
Last edited by a moderator:
While I was reviewing this thread, I realized that all the scripts published here use exponential moving average for the construction of Didi Index.

I just want to observe that the original Didi Index, as defined by Didi himself is constructed with simple moving averages instead. In my experience, as part of his trading system, the original version works better for real trading. Unfortunately, all his videos are in Portuguese, even when he lives in USA, which makes it difficult for many people to understand the methodology.

one of the clearest videos explaining the method
though it is in Portuguese but still you can get an idea.
 
Last edited:
what exactly is 3,8,20 on the Loken indicator?
I referred to LOKEN's "Tribute to David Paul" indicator where average periods are default at 21, 55, 89 , so I suggested to change respectively for 3, 8, 20 periods as those are used in Didi Index (part of Didi trading system), for those that follow that system as it adds visually, including those that prefer to use directly the 3 moving averages instead of the Didi Index.
 

Join useThinkScript to post your question to a community of 21,000+ developers and traders.

Similar threads

Not the exact question you're looking for?

Start a new thread and receive assistance from our community.

87k+ Posts
471 Online
Create Post

Similar threads

Similar threads

The Market Trading Game Changer

Join 2,500+ subscribers inside the useThinkScript VIP Membership Club
  • Exclusive indicators
  • Proven strategies & setups
  • Private Discord community
  • ‘Buy The Dip’ signal alerts
  • Exclusive members-only content
  • Add-ons and resources
  • 1 full year of unlimited support

Frequently Asked Questions

What is useThinkScript?

useThinkScript is the #1 community of stock market investors using indicators and other tools to power their trading strategies. Traders of all skill levels use our forums to learn about scripting and indicators, help each other, and discover new ways to gain an edge in the markets.

How do I get started?

We get it. Our forum can be intimidating, if not overwhelming. With thousands of topics, tens of thousands of posts, our community has created an incredibly deep knowledge base for stock traders. No one can ever exhaust every resource provided on our site.

If you are new, or just looking for guidance, here are some helpful links to get you started.

What are the benefits of VIP Membership?
VIP members get exclusive access to these proven and tested premium indicators: Buy the Dip, Advanced Market Moves 2.0, Take Profit, and Volatility Trading Range. In addition, VIP members get access to over 50 VIP-only custom indicators, add-ons, and strategies, private VIP-only forums, private Discord channel to discuss trades and strategies in real-time, customer support, trade alerts, and much more. Learn all about VIP membership here.
How can I access the premium indicators?
To access the premium indicators, which are plug and play ready, sign up for VIP membership here.
Back
Top