You should upgrade or use an alternative browser.
thinkScript GetATMOption to plot straddle price
- Thread starter thinky
- Start date
RobertPayne
Member
input TargetRatio = 1.015;
input barexit = 2;
def LongTarget = LongEnt * TargetRatio;
def LongExt= LongTarget or LongEnt from barexit bars ago;
AddOrder(OrderType.SELL_TO_CLOSE, LongExt, close, TradeSize);
In the statement highlighted above, you are trying to set LongTarget as the order entry price * the TargetRatio. However, the variable LongEnt is NOT the order entry price. Recall that you defined that variable as your entry conditions. So, it is a boolean condition. That means it will have a value of either true or false which is interpreted by the computer as either a 1 or a 0.
So, def LongTarget = LongEnt * TargetRatio; will either be 1 * 1.015 or 0 * 1.015. Neither of which is what you intended.
Take a look at this reference regarding the EntryPrice() function.
I believe what you want is something along the lines of this:
input TargetRatio = 1.015;
input barexit = 2;
def LongTarget = EntryPrice() * TargetRatio;
def LongExt= (close >= LongTarget) or (LongEnt from barexit bars ago);
AddOrder(OrderType.SELL_TO_CLOSE, LongExt, close, TradeSize);
Whew....this is, certainly, not pretty; but, here is the best I could come up with.
input expirationDate = 20191019;

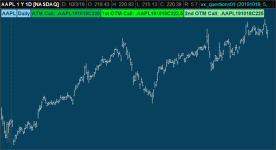
AddLabel(IsOptionable(), "ATM Call: " + GetATMOption(GetUnderlyingSymbol(), expirationDate, OptionClass.CALL), Color.UPTICK);
AddLabel(IsOptionable(), "1st OTM Call: " + GetNextOTMOption(GetATMOption(GetUnderlyingSymbol(), expirationDate, OptionClass.CALL)), Color.GREEN);
AddLabel(IsOptionable(), "2nd OTM Call: " + GetNextOTMOption(GetNextOTMOption(GetATMOption(GetUnderlyingSymbol(), expirationDate, OptionClass.CALL))), Color.LIGHT_GREEN);
Take a look at the option related functions then do something similar on the PUT side.
Attachments
Join useThinkScript to post your question to a community of 21,000+ developers and traders.
RobertPayne
Member
@RobertPayne Thanks. It seems TS doesn't provide the means to get price from codes.
Sure it does. Just make certain that you use the EntryPrice() function after the buy order code.
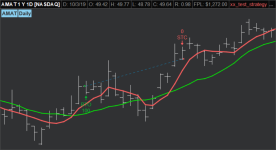
For example, let's say we want to initiate a BUY order when the MA5 crosses above the MA13. Then, we want to SELL when the closing price is at least $2.00 higher than the purchase price. That can be accomplished with the following code.
def MA5 = Average(close, 5);
def MA13 = Average(close, 13);
def buyCondition = MA5 crosses above MA13;
AddOrder(OrderType.BUY_TO_OPEN, buyCondition, open[-1], 100, Color.UPTICK, Color.UPTICK, "BTO");
def sellCondition = close >= EntryPrice() + 2;
AddOrder(OrderType.SELL_TO_CLOSE, sellCondition, open[-1], 100, Color.DOWNTICK, Color.DOWNTICK, "STC");
Attachments
GetATMOption(GetUnderlyingSymbol(), expirationDate, OptionClass.CALL)
How do you get price using that function? The code you posted last doesn't seem to use it.
If this is at all possible in ThinkScript, I need to get the prices of individual options (legs), then come up with prices for the ATM Straddle and OTM Strangles, then add those numbers. But the problem is getting the option prices in the first place.
OptionPrice() function is the only function related to pricing and doesn't seem to use OPRA codes (doesn't use the other function above).
One issue with that function is that it asks for interest rate and yield.
RobertPayne
Member
GetATMOption(GetUnderlyingSymbol(), expirationDate, OptionClass.CALL)
How do you get price using that function? The code you posted last doesn't seem to use it.
I misunderstood your original request. I thought you were just looking for the symbols, which is the difficult part.
Alright, now that you do have the symbols, it's a simple matter to use that information to get the price.
Let me ask you, how would you show the ask price for AAPL while viewing a GOOGL chart?
The answer is found here: Thinkscript fundamentals functions.
By applying what you already know about obtaining the option's symbol and what you learned from the above link, you can achieve this:
RobertPayne
Member
@RobertPayne Got it working, thanks.
EDIT: The option function (returns a code) can be used with a fundamental function (returns price) to get the option price:
close(symbol = GetATMOption(GetUnderlyingSymbol(), Date, OptionClass.CALL))
To add to what thinky posted, if you want the bid / ask price of an option, use the following
def expDate = 20191019; #options expiration date
def bidPrice = close(symbol = GetATMOption(GetUnderlyingSymbol(), expDate, OptionClass.CALL), priceType = PriceType.BID);
def askPrice = close(symbol = GetATMOption(GetUnderlyingSymbol(), expDate, OptionClass.CALL), priceType = PriceType.ASK);When i try to plot ATM option close price on the chart as a line instead of a label, the line blinks between price and N/A (or 0), and totally repaints the ATM close price when underlying price changes. Is it possible to have the indicator plot line stay without disappearing whenever the underlying price fluctuates?
For example, at market open let's say 250 is the ATM option strike and after few mins 255 is the ATM option strike. Can we draw the indicator by dynamically taking in the ATM option price and continue draw the line as price changes without having the issue of repainting the entire plot?
Thanks!
I was using following code but its not plotting. I found out GetATMOption function doesn't return value. Can somebody please help me here ?
plot Data = close;
declare lower;
input expirationDate = 20200612;
plot AprilATMPutPrice = close(GetATMOption(GetUnderlyingSymbol(), expirationDate, OptionClass.PUT));
Thanks for your time.
Shooters_Gotta_Shoot
Member
Internet Name
Member
@RobertPayne just wanted to let you know that these aren't working for some reason. I tried them over the weekend and nothing appeared, so I wanted to wait till the market was active today and still no response from the program. The labels appear but the actual options don't appear.
The labels are blank because the saturday date has to be used rather than the friday expiration.
This code has been adjusted so you can use the friday expiration.
input expirationDate = 20220114;

AddLabel(IsOptionable(), "ATM Call: " + GetATMOption(GetUnderlyingSymbol(), expirationDate+1, OptionClass.CALL), Color.UPTICK);
AddLabel(IsOptionable(), "1st OTM Call: " + GetNextOTMOption(GetATMOption(GetUnderlyingSymbol(), expirationDate+1, OptionClass.CALL)), Color.GREEN);
AddLabel(IsOptionable(), "2nd OTM Call: " + GetNextOTMOption(GetNextOTMOption(GetATMOption(GetUnderlyingSymbol(), expirationDate+1, OptionClass.CALL))), Color.LIGHT_GREEN);
Unless I'm misunderstanding what is being discussed above, I do not believe the options functions are broken (although they don't work very well). But I have noticed that things like the bid and ask on options only work during market hours, so you have to write a code to return the last option price that is !IsNaN if you want to see those prices during market close.
I have the problem. Did you ever solve?Hello @RobertPayne
When i try to plot ATM option close price on the chart as a line instead of a label, the line blinks between price and N/A (or 0), and totally repaints the ATM close price when underlying price changes. Is it possible to have the indicator plot line stay without disappearing whenever the underlying price fluctuates?
For example, at market open let's say 250 is the ATM option strike and after few mins 255 is the ATM option strike. Can we draw the indicator by dynamically taking in the ATM option price and continue draw the line as price changes without having the issue of repainting the entire plot?
Thanks!
I have the problem. Did you ever solve?
it is unclear what you are asking.
the original post was vague.
you didn't reference any code. this thread just has code pieces here and there.
post the code you tried and write out full sentences, describing what you want to see.
The question above was:it is unclear what you are asking.
the original post was vague.
you didn't reference any code. this thread just has code pieces here and there.
post the code you tried and write out full sentences, describing what you want to see.
Can we draw the indicator by dynamically taking in the ATM option price and continue draw the line as price changes without having the issue of repainting the entire plot?
It has to do with getatmoption().
I seem to have possibly answered my own question.The question above was:
Can we draw the indicator by dynamically taking in the ATM option price and continue draw the line as price changes without having the issue of repainting the entire plot?
It has to do with getatmoption().
In order to shorten lengthy scripts , you an define IsOption as the test, then encapusulate it upfront of the def to test, then def[1] if true, or else the 2nd part.
def isoption = IsNaN(close(symbol = GetATMOption(GetUnderlyingSymbol(), expiry, if isCall then OptionClass.CALL else OptionClass.PUT)));
def getatmprice = if((isoption), getatmprice[1], close(symbol = GetATMOption(GetUnderlyingSymbol(), expiry, if isCall then OptionClass.CALL else OptionClass.PUT)));
def getatmvol = if((isoption), getatmvol[1], volume(symbol = GetATMOption(GetUnderlyingSymbol(), expiry, if isCall then OptionClass.CALL else OptionClass.PUT)));
Similar threads
-
-
ThinkScript Portfolio Functions In ThinkOrSwim Are Now Working!
- Started by Mark1126
- Replies: 11
-
Choppiness Index thinkscript and Chandelier Indicator thinkscript
- Started by spartacus
- Replies: 1
-
Net Liq on Chart thinkscript not working for an account on TD
- Started by eugchen
- Replies: 1
-
Not the exact question you're looking for?
Start a new thread and receive assistance from our community.
Similar threads
-
-
ThinkScript Portfolio Functions In ThinkOrSwim Are Now Working!
- Started by Mark1126
- Replies: 11
-
Choppiness Index thinkscript and Chandelier Indicator thinkscript
- Started by spartacus
- Replies: 1
-
Net Liq on Chart thinkscript not working for an account on TD
- Started by eugchen
- Replies: 1
-
The Market Trading Game Changer
- Exclusive indicators
- Proven strategies & setups
- Private Discord community
- ‘Buy The Dip’ signal alerts
- Exclusive members-only content
- Add-ons and resources
- 1 full year of unlimited support
Frequently Asked Questions
useThinkScript is the #1 community of stock market investors using indicators and other tools to power their trading strategies. Traders of all skill levels use our forums to learn about scripting and indicators, help each other, and discover new ways to gain an edge in the markets.
We get it. Our forum can be intimidating, if not overwhelming. With thousands of topics, tens of thousands of posts, our community has created an incredibly deep knowledge base for stock traders. No one can ever exhaust every resource provided on our site.
If you are new, or just looking for guidance, here are some helpful links to get you started.
- The most viewed thread:
https://usethinkscript.com/threads/repainting-trend-reversal-for-thinkorswim.183/ - Our most popular indicator:
https://usethinkscript.com/threads/buy-the-dip-indicator-for-thinkorswim.3553/ - Answers to frequently asked questions:
https://usethinkscript.com/threads/answers-to-commonly-asked-questions.6006/


