The Basis For All Statistics:
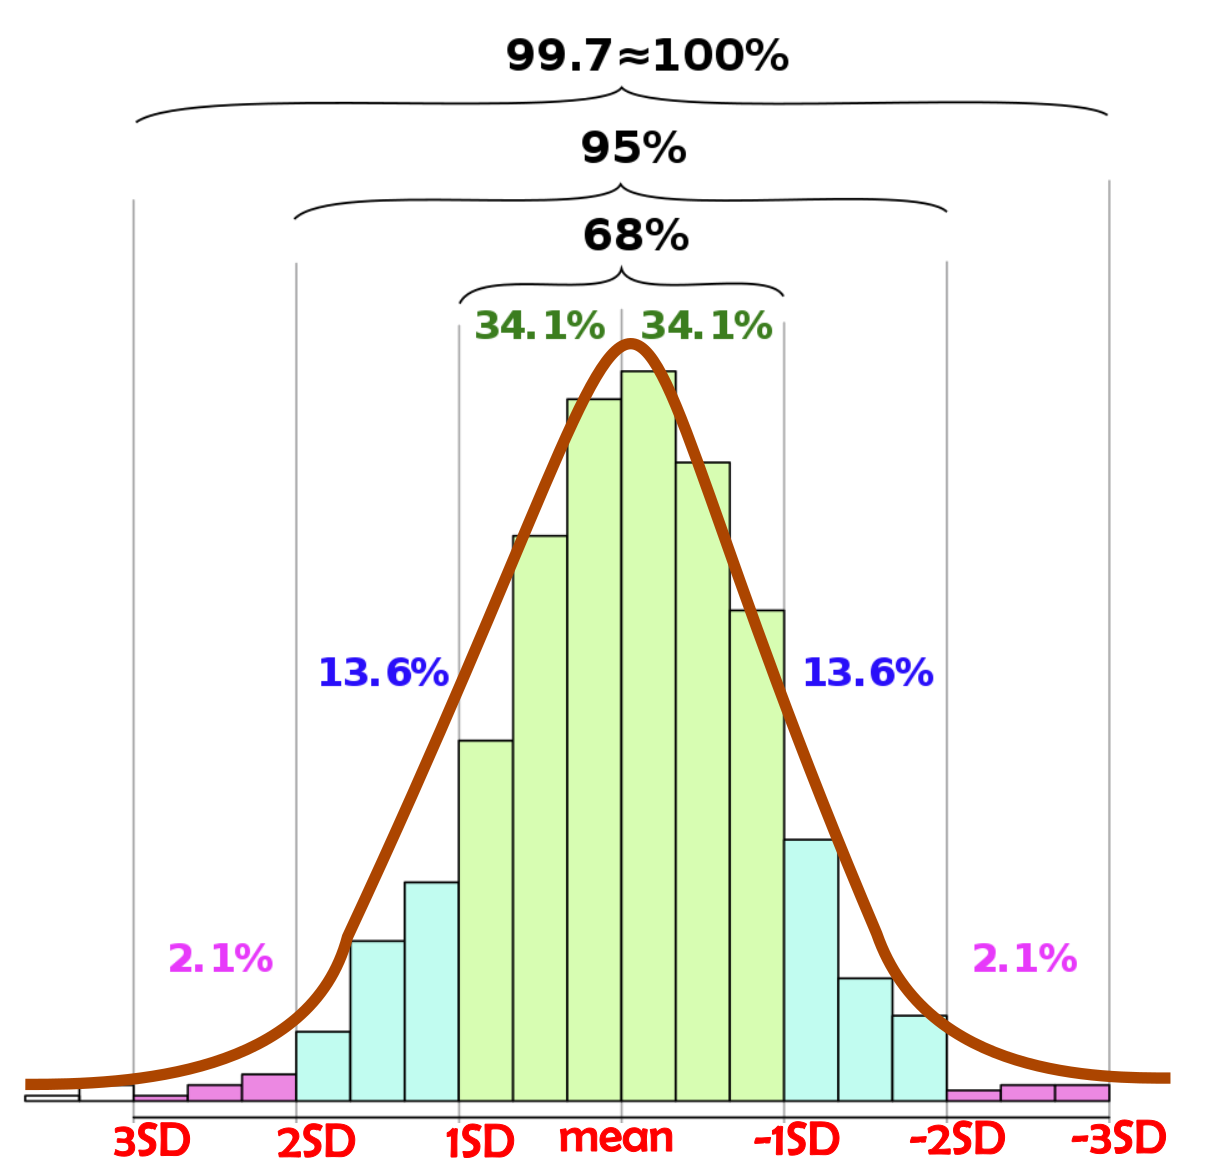
Normally distributed data sets generally fall into a bell curve

Given that the majority of movement stays within one standard deviation (SD) of the mean;
Traders commonly use standard deviations to guessimate their potential targets and to set their stop-losses.
Trends, imbalances, and external factors often create skewed distributions.
Therefore, the Empirical Rule is not a perfect fit to the unpredictable world of trading.
—BUT standard deviation analysis still rules!
Here is why:
By identifying the skew of the normal distribution; the standard deviation analysis can be moved up/down to accurately determine volatility and probabilities.
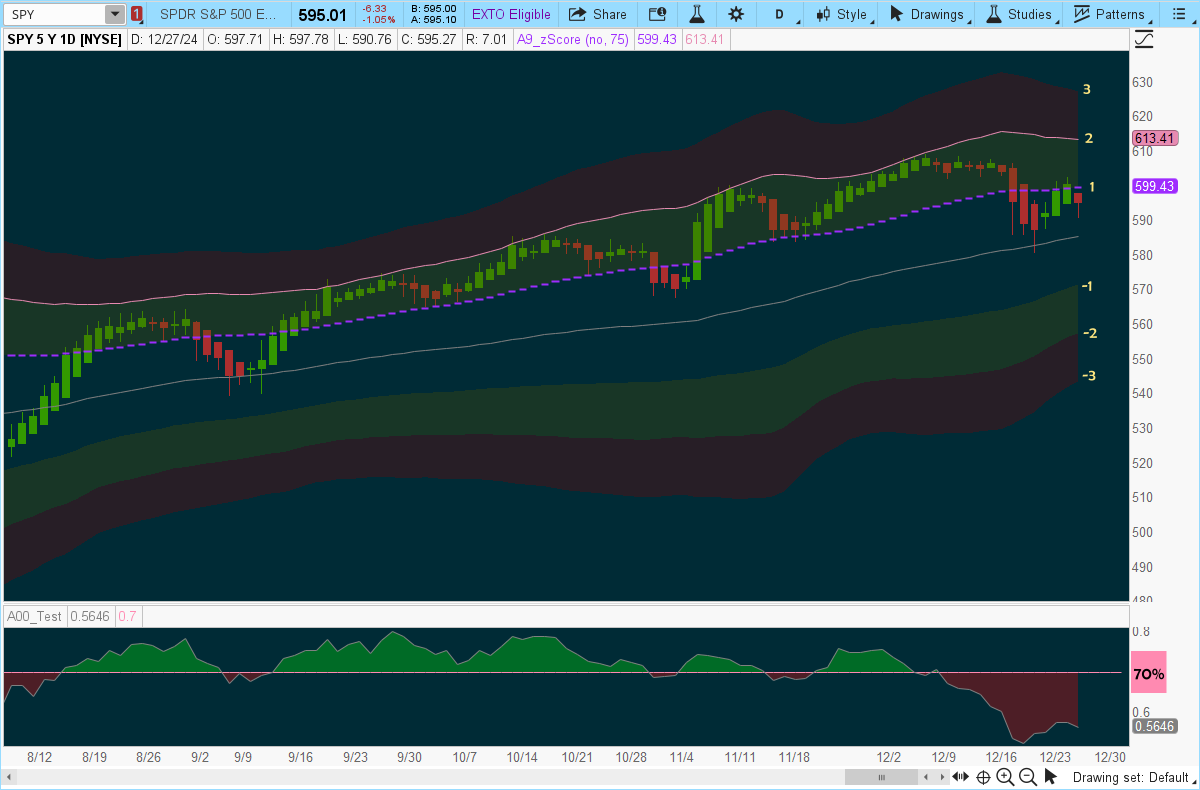
The below chart uses the Z-Score Probability Upper Study to depict Standard Deviation

No, SPY did not obey the empirical rule, on the above chart.
Price did not trend within one standard deviation and the mean, 68% of the time.
It set a new normal. Price trended between 2SD (pink line) and 1SD (purple dashes) over 68% of the time.
These types of deviations from the Empirical Rule are typical in trading.
In the above chart, the lower study shows that 68-70% of the S&P 500 was trending above their 200-day moving average, the majority of the time; resulting in prices clustered above the mean, thus obviously, skewing the distribution higher.
Standard deviation analysis still applies but needs to be adjusted one deviation higher.
Conclusion:
Markets and instruments do not stick exactly to the Empirical Rule.
They will find their own normal distribution.
In the case of the above bullish trend, 2SD was not "too volatile". It was the normal.
Finding the range of the normal distribution is essential in understanding the volatility driving price; and the probability of where price is going to end up!

Think of the Empirical Rule as a useful guide in ideal conditions, but not a strict rule book for trading. Markets are dynamic. But in most cases (excluding fat tail events), standard deviations can still be used to analyze volatility and probabilities.
Normally distributed data sets generally fall into a bell curve
The Empirical Rule, also called the 68-95-99.7 Rule
applies to normally distributed data sets.

68% of data stays within one standard deviation (SD) of the mean,
95% within two SDs,
99.7% within three SDs.
Given that the majority of movement stays within one standard deviation (SD) of the mean;
Traders commonly use standard deviations to guessimate their potential targets and to set their stop-losses.
*****************************************************
But markets and instruments rarely exhibit a perfectly normal distribution. Trends, imbalances, and external factors often create skewed distributions.
Therefore, the Empirical Rule is not a perfect fit to the unpredictable world of trading.
—BUT standard deviation analysis still rules!
Here is why:
By identifying the skew of the normal distribution; the standard deviation analysis can be moved up/down to accurately determine volatility and probabilities.
The below chart uses the Z-Score Probability Upper Study to depict Standard Deviation
The lower VIP study on this chart displays the percentage of S&P500 stocks trading above their 200-day moving average. read more: https://usethinkscript.com/threads/market-internals-labels-for-thinkorswim.833/#post-140289one standard deviation == purple dashed line
two standard deviations == pink line

No, SPY did not obey the empirical rule, on the above chart.
Price did not trend within one standard deviation and the mean, 68% of the time.
It set a new normal. Price trended between 2SD (pink line) and 1SD (purple dashes) over 68% of the time.
These types of deviations from the Empirical Rule are typical in trading.
In the above chart, the lower study shows that 68-70% of the S&P 500 was trending above their 200-day moving average, the majority of the time; resulting in prices clustered above the mean, thus obviously, skewing the distribution higher.
Standard deviation analysis still applies but needs to be adjusted one deviation higher.
Conclusion:
Markets and instruments do not stick exactly to the Empirical Rule.
They will find their own normal distribution.
In the case of the above bullish trend, 2SD was not "too volatile". It was the normal.
Finding the range of the normal distribution is essential in understanding the volatility driving price; and the probability of where price is going to end up!
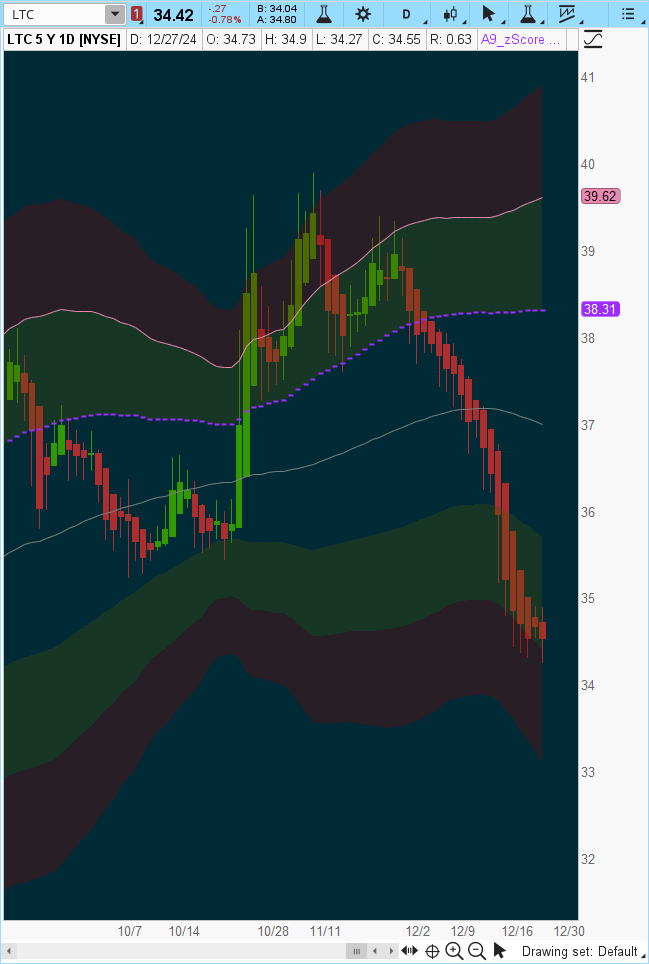
Here is another exampleSharp moves can lead to extreme deviations (as seen in this lithium futures chart)
—These "fat tail events"— totally disrupt normal distribution, thus no price movement probabilities can be assigned.

Think of the Empirical Rule as a useful guide in ideal conditions, but not a strict rule book for trading. Markets are dynamic. But in most cases (excluding fat tail events), standard deviations can still be used to analyze volatility and probabilities.
Last edited by a moderator:
