# ema10_cross_20_chg
#https://usethinkscript.com/threads/symbols-appear-on-price-when-ema-10-cross-above-ema20.16402/
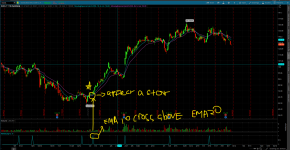
#Symbols appear on Price when EMA 10 cross above EMA20
def na = double.nan;
def bn = barnumber();
def price = close;
input avg1_len = 10;
input avg1_type = AverageType.EXPONENTIAL;
def avg1 = MovingAverage(avg1_type, price, avg1_len);
input avg2_len = 20;
input avg2_type = AverageType.EXPONENTIAL;
def avg2 = MovingAverage(avg2_type, price, avg2_len);
def xup = avg1 crosses above avg2;
def xdwn = avg1 crosses below avg2;
input show_lines = yes;
plot z1 = if show_lines then avg1 else na;
z1.setdefaultcolor(getcolor(1));
#z1.setlineweight(1);
z1.hidebubble();
plot z2 = if show_lines then avg2 else na;
z2.setdefaultcolor(getcolor(2));
#z2.setlineweight(1);
z2.hidebubble();
# this doesn't assign the color in quotes.
# the location of the picked color in the series, is changed to a number
# ex. pink is the 3rd number. (0-9) 2 is saved in color1_choice ( count starts at 0)
input cross_up_color = { "magenta", default "cyan", "pink", "gray", "orange", "red", "green", "dark_gray", "yellow", "white"};
input cross_up_shape = { DASH, default POINT, SQUARE, TRIANGLE, ARROW_UP, ARROW_DOWN };
input shape_size = 3;
input cross_down_color = { "magenta", "cyan", default "pink", "gray", "orange", "red", "green", "dark_gray", "yellow", "white"};
input cross_down_shape = { DASH, default POINT, SQUARE, TRIANGLE, ARROW_UP, ARROW_DOWN };
def plotupy = low * 0.998;
def plotdwny = high * 1.002;
plot zu1 = if xup and cross_up_shape == cross_up_shape.dash then plotupy else na;
zu1.SetPaintingStrategy(PaintingStrategy.DASHES);
zu1.SetDefaultColor(getcolor(cross_up_color));
zu1.setlineweight(shape_size);
zu1.hidebubble();
plot zu2 = if xup and cross_up_shape == cross_up_shape.point then plotupy else na;
zu2.SetPaintingStrategy(PaintingStrategy.POINTS);
zu2.SetDefaultColor(getcolor(cross_up_color));
zu2.setlineweight(shape_size);
zu2.hidebubble();
plot zu3 = if xup and cross_up_shape == cross_up_shape.square then plotupy else na;
zu3.SetPaintingStrategy(PaintingStrategy.SQUARES);
zu3.SetDefaultColor(getcolor(cross_up_color));
zu3.setlineweight(shape_size);
zu3.hidebubble();
plot zu4 = if xup and cross_up_shape == cross_up_shape.triangle then plotupy else na;
zu4.SetPaintingStrategy(PaintingStrategy.TRIANGLES);
zu4.SetDefaultColor(getcolor(cross_up_color));
zu4.setlineweight(shape_size);
zu4.hidebubble();
plot zu5 = if xup and cross_up_shape == cross_up_shape.arrow_up then plotupy else na;
zu5.SetPaintingStrategy(PaintingStrategy.ARROW_UP);
zu5.SetDefaultColor(getcolor(cross_up_color));
zu5.setlineweight(shape_size);
zu5.hidebubble();
plot zu6 = if xup and cross_up_shape == cross_up_shape.arrow_down then plotupy else na;
zu6.SetPaintingStrategy(PaintingStrategy.ARROW_down);
zu6.SetDefaultColor(getcolor(cross_up_color));
zu6.setlineweight(shape_size);
zu6.hidebubble();
plot zd1 = if xdwn and cross_down_shape == cross_down_shape.dash then plotdwny else na;
zd1.SetPaintingStrategy(PaintingStrategy.DASHES);
zd1.SetDefaultColor(getcolor(cross_up_color));
zd1.setlineweight(shape_size);
zd1.hidebubble();
plot zd2 = if xdwn and cross_down_shape == cross_down_shape.point then plotdwny else na;
zd2.SetPaintingStrategy(PaintingStrategy.POINTS);
zd2.SetDefaultColor(getcolor(cross_down_color));
zd2.setlineweight(shape_size);
zd2.hidebubble();
plot zd3 = if xdwn and cross_down_shape == cross_down_shape.square then plotdwny else na;
zd3.SetPaintingStrategy(PaintingStrategy.SQUARES);
zd3.SetDefaultColor(getcolor(cross_down_color));
zd3.setlineweight(shape_size);
zd3.hidebubble();
plot zd4 = if xdwn and cross_down_shape == cross_down_shape.triangle then plotdwny else na;
zd4.SetPaintingStrategy(PaintingStrategy.TRIANGLES);
zd4.SetDefaultColor(getcolor(cross_up_color));
zd4.setlineweight(shape_size);
zd4.hidebubble();
plot zd5 = if xdwn and cross_down_shape == cross_down_shape.arrow_up then plotdwny else na;
zd5.SetPaintingStrategy(PaintingStrategy.ARROW_UP);
zd5.SetDefaultColor(getcolor(cross_down_color));
zd5.setlineweight(shape_size);
zd5.hidebubble();
plot zd6 = if xdwn and cross_down_shape == cross_down_shape.arrow_down then plotdwny else na;
zd6.SetPaintingStrategy(PaintingStrategy.ARROW_down);
zd6.SetDefaultColor(getcolor(cross_down_color));
zd6.setlineweight(shape_size);
zd6.hidebubble();
#