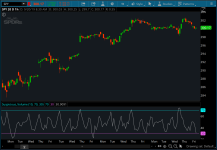
This indicator helps to identify suspicious volume.
When the volume line goes above 70 or below 30, we can assume that the trading volume is abnormal.

The ratio of the current volume to the average of several previous candlesticks has been defined as standardized between 0 and 100.
When the volume line goes above 70 or below 30, we can assume that the trading volume is abnormal.
thinkScript Code
Code:
# Suspicious Volume
# Assembled by BenTen at useThinkScript.com
# Converted from https://www.tradingview.com/script/EskEEMKW-Suspicious-Volume/

declare lower;

def Totlavol = volume;
input Ma_period = 10;
input highVol = 70;
input lowVol = 30;

def smaVol = simpleMovingAvg(Totlavol, Ma_period);
def volnow = volume[0];
def SVolume_index = (volnow / smaVol);
def sv_index = (100 - (100 / (1 + SVolume_index)));

plot h_vol = highVol;
plot l_vol = lowVol;

plot line = sv_index;
Attachments
Last edited:

