# supply_demand_lines_till_crossed
#https://usethinkscript.com/threads/supply-and-demand-zone-problems.22227/
#Supply and Demand zone problems
#rene6985 3/29
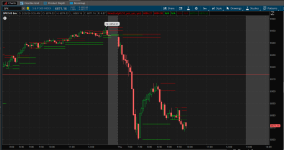
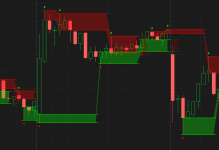
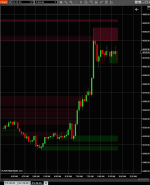
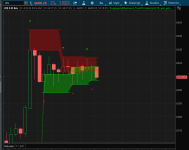
#This is Supply and Demand zone, I created using ChatGPT and Claude AI, I tried working with them and we encounter problems,
#ChatGPT use and interpret it as a cloud where the zones jump one to the other, Horizontal parallel line. I want it to be when the zone is created, it would stay there until broken and will redraw but lighter. ChatGPT said it cannot be done, because TOS cannot draw a rectangle or a Box, it need to be a cloud version to do it. Any help would be usefull.
# SupDemZones - ThinkScript for ThinkorSwim
# No cloud version - visible zone boundaries only
# Pivot-start anchored version
declare upper;
input atrPeriod = 10;
input showActiveZones = yes;
input showBrokenZones = yes;
input showContinuationZones = yes;
def na = Double.NaN;
def bn = BarNumber();
# ============================================================
# CORE CALCULATIONS
# ============================================================
def tr = TrueRange(high, close, low);
def atrVal = Average(tr, atrPeriod) * 1.25;
def kcBasis = ExpAverage(close, 10);
def kcRange = Average(tr, 10);
def kcUpper = kcBasis + kcRange;
def kcLower = kcBasis - kcRange;
#-----------------------
# SWING HIGH / LOW DETECTION (3-bar left, 3-bar right)
# create a true/false signal, on the peak or valley bar
# find peaks/valleys
#https://usethinkscript.com/threads/zigzag-high-low-with-supply-demand-zones-for-thinkorswim.172/#post-7048
#post10
# Robert Payne
# https://funwiththinkscript.com
#def lastBar = HighestAll(if IsNaN(close) then 0 else bn);
def lastbn = HighestAll(if IsNaN(close) then 0 else bn);
def lastbar = bn == lastbn;
#def lastbar = (!isnan(close) and isnan(close[-1]));
def highx = high;
def lowx = low;
input peak_bars = 3;
def length = peak_bars;
def offset = Min(length - 1, lastbn - bn);
def peak = highx > Highest(highx[1], length - 1) and highx == GetValue(Highest(highx, length), -offset);
def valley = lowx < Lowest(lowx[1], length - 1) and lowx == GetValue(Lowest(lowx, length), -offset);
# show a dot on peaks and valleys
plot zhi = if peak then high*1.001 else na;
plot zlo = if valley then low*0.999 else na;
#zlo.SetPaintingStrategy(PaintingStrategy.ARROW_UP);
zlo.SetPaintingStrategy(PaintingStrategy.points);
zlo.SetDefaultColor(Color.red);
zlo.setlineweight(2);
zlo.hidebubble();
#zhi.SetPaintingStrategy(PaintingStrategy.ARROW_DOWN);
zhi.SetPaintingStrategy(PaintingStrategy.points);
zhi.SetDefaultColor(Color.green);
zhi.setlineweight(2);
zhi.hidebubble();
def isSwingHigh = peak;
def isSwingLow = valley;
#-----------------------
# ============================================================
# SWING HIGH / LOW DETECTION (3-bar left, 3-bar right)
# ============================================================
def swingHighVal =
if high[3] >= high[0] and
high[3] >= high[1] and
high[3] >= high[2] and
high[3] >= high[4] and
high[3] >= high[5] and
high[3] >= high[6]
then high[3]
else na;
def swingLowVal =
if low[3] <= low[0] and
low[3] <= low[1] and
low[3] <= low[2] and
low[3] <= low[4] and
low[3] <= low[5] and
low[3] <= low[6]
then low[3]
else na;
#def isSwingHigh = !IsNaN(swingHighVal);
#def isSwingLow = !IsNaN(swingLowVal);
# ============================================================
# SUPPLY ZONE CONSTRUCTION
# ============================================================
#def supplyPivotHigh = high[3];
#def supplyBodyBase =
# if (supplyPivotHigh - Min(open[3], close[3])) > atrVal[3]
# then Max(open[3], close[3])
# else Min(open[3], close[3]);
def supplyPivotHigh = high[0];
def supplyBodyBase =
if (supplyPivotHigh - Min(open[0], close[0])) > atrVal[0]
then Max(open[0], close[0])
else Min(open[0], close[0]);
def newSupplyZH = if isSwingHigh then supplyPivotHigh else na;
def newSupplyZL =
if isSwingHigh then
(if supplyPivotHigh - supplyBodyBase < TickSize()
then supplyPivotHigh - TickSize()
else supplyBodyBase)
else na;
def newSupplyZone = isSwingHigh;
# ============================================================
# DEMAND ZONE CONSTRUCTION
# ============================================================
#def demandPivotLow = low[3];
#def demandBodyTop =
# if (Max(open[3], close[3]) - demandPivotLow) > atrVal[3]
# then Min(open[3], close[3])
# else Max(open[3], close[3]);
def demandPivotLow = low[0];
def demandBodyTop =
if (Max(open[0], close[0]) - demandPivotLow) > atrVal[0]
then Min(open[0], close[0])
else Max(open[0], close[0]);
def newDemandZL = if isSwingLow then demandPivotLow else na;
def newDemandZH =
if isSwingLow then
(if demandBodyTop - demandPivotLow < TickSize()
then demandPivotLow + TickSize()
else demandBodyTop)
else na;
def newDemandZone = isSwingLow;
# ============================================================
# STORE ZONE START BAR AT ORIGINAL PIVOT
# ============================================================
#def supplyStartBar = CompoundValue(1, if newSupplyZone then bn - 3 else supplyStartBar[1], 0);
#def demandStartBar = CompoundValue(1, if newDemandZone then bn - 3 else demandStartBar[1], 0);
def supplyStartBar = CompoundValue(1, if newSupplyZone then bn - 0 else supplyStartBar[1], 0);
def demandStartBar = CompoundValue(1, if newDemandZone then bn - 0 else demandStartBar[1], 0);
# ============================================================
# STORE SUPPLY ZONE STATE
# ============================================================
def supplyZH_Stored = CompoundValue(1,
if newSupplyZone then newSupplyZH else supplyZH_Stored[1], na);
def supplyZL_Stored = CompoundValue(1,
if newSupplyZone then newSupplyZL else supplyZL_Stored[1], na);
def supplyBrokenState = CompoundValue(1,
if newSupplyZone then 0
else if supplyBrokenState[1] == 0 and !IsNaN(supplyZH_Stored[1]) and high > supplyZH_Stored[1] then 1
else supplyBrokenState[1], 0);
# ============================================================
# STORE DEMAND ZONE STATE
# ============================================================
def demandZL_Stored = CompoundValue(1, if newDemandZone then newDemandZL else demandZL_Stored[1], na);
def demandZH_Stored = CompoundValue(1, if newDemandZone then newDemandZH else demandZH_Stored[1], na);
def demandBrokenState = CompoundValue(1,
if newDemandZone then 0
else if demandBrokenState[1] == 0 and !IsNaN(demandZL_Stored[1]) and low < demandZL_Stored[1] then 1
else demandBrokenState[1], 0);
# ============================================================
# ACTIVE SUPPLY ZONE - no cloud
# ============================================================
plot SupplyHigh =
if showActiveZones and supplyBrokenState == 0 and !IsNaN(supplyZH_Stored) and bn >= supplyStartBar
then supplyZH_Stored
else na;
plot SupplyLow =
if showActiveZones and supplyBrokenState == 0 and !IsNaN(supplyZL_Stored) and bn >= supplyStartBar
then supplyZL_Stored
else na;
SupplyHigh.SetDefaultColor(Color.RED);
SupplyLow.SetDefaultColor(Color.RED);
SupplyHigh.SetLineWeight(1);
SupplyLow.SetLineWeight(1);
SupplyHigh.SetPaintingStrategy(PaintingStrategy.HORIZONTAL);
SupplyLow.SetPaintingStrategy(PaintingStrategy.HORIZONTAL);
SupplyHigh.HideBubble();
SupplyLow.HideBubble();
addcloud(supplyHigh, supplyLow, Color.RED);
# ============================================================
# ACTIVE DEMAND ZONE - no cloud
# ============================================================
plot DemandHigh =
if showActiveZones and demandBrokenState == 0 and !IsNaN(demandZH_Stored) and bn >= demandStartBar
then demandZH_Stored
else na;
plot DemandLow =
if showActiveZones and demandBrokenState == 0 and !IsNaN(demandZL_Stored) and bn >= demandStartBar
then demandZL_Stored
else na;
DemandHigh.SetDefaultColor(Color.GREEN);
DemandLow.SetDefaultColor(Color.GREEN);
DemandHigh.SetLineWeight(1);
DemandLow.SetLineWeight(1);
DemandHigh.SetPaintingStrategy(PaintingStrategy.HORIZONTAL);
DemandLow.SetPaintingStrategy(PaintingStrategy.HORIZONTAL);
DemandHigh.HideBubble();
DemandLow.HideBubble();
addcloud(demandHigh, demandLow, Color.green);
# ============================================================
# BROKEN SUPPLY ZONE - no cloud
# ============================================================
plot BrokenSupplyHigh =
if showBrokenZones and supplyBrokenState == 1 and !IsNaN(supplyZH_Stored) and bn >= supplyStartBar
then supplyZH_Stored
else na;
plot BrokenSupplyLow =
if showBrokenZones and supplyBrokenState == 1 and !IsNaN(supplyZL_Stored) and bn >= supplyStartBar
then supplyZL_Stored
else na;
BrokenSupplyHigh.SetDefaultColor(Color.DARK_RED);
BrokenSupplyLow.SetDefaultColor(Color.DARK_RED);
BrokenSupplyHigh.SetLineWeight(1);
BrokenSupplyLow.SetLineWeight(1);
BrokenSupplyHigh.SetPaintingStrategy(PaintingStrategy.HORIZONTAL);
BrokenSupplyLow.SetPaintingStrategy(PaintingStrategy.HORIZONTAL);
BrokenSupplyHigh.HideBubble();
BrokenSupplyLow.HideBubble();
addcloud(BrokenSupplyHigh, BrokenSupplyLow, Color.DARK_RED);
# ============================================================
# BROKEN DEMAND ZONE - no cloud
# ============================================================
plot BrokenDemandHigh =
if showBrokenZones and demandBrokenState == 1 and !IsNaN(demandZH_Stored) and bn >= demandStartBar
then demandZH_Stored
else na;
plot BrokenDemandLow =
if showBrokenZones and demandBrokenState == 1 and !IsNaN(demandZL_Stored) and bn >= demandStartBar
then demandZL_Stored
else na;
BrokenDemandHigh.SetDefaultColor(Color.DARK_GREEN);
BrokenDemandLow.SetDefaultColor(Color.DARK_GREEN);
BrokenDemandHigh.SetLineWeight(1);
BrokenDemandLow.SetLineWeight(1);
BrokenDemandHigh.SetPaintingStrategy(PaintingStrategy.HORIZONTAL);
BrokenDemandLow.SetPaintingStrategy(PaintingStrategy.HORIZONTAL);
BrokenDemandHigh.HideBubble();
BrokenDemandLow.HideBubble();
addcloud(BrokendemandHigh, BrokendemandLow, Color.DARK_green);
# ============================================================
# ALERTS
# ============================================================
Alert(newSupplyZone, "New Supply Zone Detected", Alert.BAR, Sound.Ding);
Alert(newDemandZone, "New Demand Zone Detected", Alert.BAR, Sound.Ding);
#