
Hello all, so I’ve realized that the StochRSI settings in thinkorswim are way different from the StochRSI on other platforms, I do like using it and I’ve tried to play around with the settings on thinkorswim to match the TradingView and can’t seem to get it right, ideally would like the StochRSI settings “3,3,14,14” from TradingView into thinkorswim. What parameters do I need to change or would a script be the answer?
You are using an out of date browser. It may not display this or other websites correctly.
You should upgrade or use an alternative browser.
You should upgrade or use an alternative browser.
StochRSI Label, Watchlist, Scan For ThinkOrSwim
- Thread starter Ramos
- Start date
Join useThinkScript to post your question to a community of 21,000+ developers and traders.
RSI length 14
K period 14
D period 3
slowing period 3
K period 14
D period 3
slowing period 3
Change the 1 (smoothing factor) to a 3. So RSI length =14, K = 14, D= 3, Slowing period = 3Hello all, so I’ve realized that the StochRSI settings in thinkorswim are way different from the StochRSI on other platforms, I do like using it and I’ve tried to play around with the settings on thinkorswim to match the TradingView and can’t seem to get it right, ideally would like the StochRSI settings “3,3,14,14” from TradingView into thinkorswim. What parameters do I need to change or would a script be the answer?
Need some help coding the StochRSI to change colors when the FullK and the FullD are above and below the oversold lines. Any help would be greatly appreciated. Attempted to do this but was getting a error.
#
# TD Ameritrade IP Company, Inc. (c) 2008-2021
#
declare lower;
input RSI_length = 14;
input over_bought = 80;
input over_sold = 20;
input RSI_average_type = AverageType.WILDERS;
input RSI_price = close;
input KPeriod = 14;
input DPeriod = 3;
input slowing_period = 1;
input averageType = AverageType.SIMPLE;
input showBreakoutSignals = {default "No", "On FullK", "On FullD", "On FullK & FullD"};
def RSI = RSI(price = RSI_price, length = RSI_length, averageType = RSI_average_type);
plot FullK = StochasticFull(over_bought, over_sold, KPeriod, DPeriod, RSI, RSI, RSI, slowing_period, averageType).FullK;
plot FullD = StochasticFull(over_bought, over_sold, KPeriod, DPeriod, RSI, RSI, RSI, slowing_period, averageType).FullD;
plot OverBought = over_bought;
plot OverSold = over_sold;
def upK = FullK crosses above OverSold;
def upD = FullD crosses above OverSold;
def downK = FullK crosses below OverBought;
def downD = FullD crosses below OverBought;
plot UpSignal;
plot DownSignal;
switch (showBreakoutSignals) {
case "No":
UpSignal = Double.NaN;
DownSignal = Double.NaN;
case "On FullK":
UpSignal = if upK then OverSold else Double.NaN;
DownSignal = if downK then OverBought else Double.NaN;
case "On FullD":
UpSignal = if upD then OverSold else Double.NaN;
DownSignal = if downD then OverBought else Double.NaN;
case "On FullK & FullD":
UpSignal = if upK or upD then OverSold else Double.NaN;
DownSignal = if downK or downD then OverBought else Double.NaN;
}
UpSignal.setHiding(showBreakoutSignals == showBreakoutSignals."No");
DownSignal.setHiding(showBreakoutSignals == showBreakoutSignals."No");
FullK.SetDefaultColor(GetColor(5));
FullD.SetDefaultColor(GetColor(0));
OverBought.SetDefaultColor(GetColor(1));
OverSold.SetDefaultColor(GetColor(1));
UpSignal.SetDefaultColor(Color.UPTICK);
UpSignal.SetPaintingStrategy(PaintingStrategy.ARROW_UP);
DownSignal.SetDefaultColor(Color.DOWNTICK);
DownSignal.SetPaintingStrategy(PaintingStrategy.ARROW_DOWN);
#
# TD Ameritrade IP Company, Inc. (c) 2008-2021
#
declare lower;
input RSI_length = 14;
input over_bought = 80;
input over_sold = 20;
input RSI_average_type = AverageType.WILDERS;
input RSI_price = close;
input KPeriod = 14;
input DPeriod = 3;
input slowing_period = 1;
input averageType = AverageType.SIMPLE;
input showBreakoutSignals = {default "No", "On FullK", "On FullD", "On FullK & FullD"};
def RSI = RSI(price = RSI_price, length = RSI_length, averageType = RSI_average_type);
plot FullK = StochasticFull(over_bought, over_sold, KPeriod, DPeriod, RSI, RSI, RSI, slowing_period, averageType).FullK;
plot FullD = StochasticFull(over_bought, over_sold, KPeriod, DPeriod, RSI, RSI, RSI, slowing_period, averageType).FullD;
plot OverBought = over_bought;
plot OverSold = over_sold;
def upK = FullK crosses above OverSold;
def upD = FullD crosses above OverSold;
def downK = FullK crosses below OverBought;
def downD = FullD crosses below OverBought;
plot UpSignal;
plot DownSignal;
switch (showBreakoutSignals) {
case "No":
UpSignal = Double.NaN;
DownSignal = Double.NaN;
case "On FullK":
UpSignal = if upK then OverSold else Double.NaN;
DownSignal = if downK then OverBought else Double.NaN;
case "On FullD":
UpSignal = if upD then OverSold else Double.NaN;
DownSignal = if downD then OverBought else Double.NaN;
case "On FullK & FullD":
UpSignal = if upK or upD then OverSold else Double.NaN;
DownSignal = if downK or downD then OverBought else Double.NaN;
}
UpSignal.setHiding(showBreakoutSignals == showBreakoutSignals."No");
DownSignal.setHiding(showBreakoutSignals == showBreakoutSignals."No");
FullK.SetDefaultColor(GetColor(5));
FullD.SetDefaultColor(GetColor(0));
OverBought.SetDefaultColor(GetColor(1));
OverSold.SetDefaultColor(GetColor(1));
UpSignal.SetDefaultColor(Color.UPTICK);
UpSignal.SetPaintingStrategy(PaintingStrategy.ARROW_UP);
DownSignal.SetDefaultColor(Color.DOWNTICK);
DownSignal.SetPaintingStrategy(PaintingStrategy.ARROW_DOWN);
@maston21 The syntax and logic for the type of color changes you are requesting is the same for all oscillators. Have you tried using the logic found in this tutorial?
https://usethinkscript.com/threads/adding-color-to-plots-and-labels.6845/
https://usethinkscript.com/threads/adding-color-to-plots-and-labels.6845/
Hello,
I am trying to customize the StochRSI indicator to change color when it goes to overbought and oversold.
I tried to use some of the code from this link and no luck.
https://usethinkscript.com/threads/adding-color-to-plots-labels-watchlists.6845/
If someone could assist that would be awesome.
Thank you!
#
# TD Ameritrade IP Company, Inc. (c) 2008-2021
#
declare lower;
input RSI_length = 14;
input over_bought = 80;
input over_sold = 20;
input RSI_average_type = AverageType.WILDERS;
input RSI_price = close;
input KPeriod = 14;
input DPeriod = 3;
input slowing_period = 1;
input averageType = AverageType.SIMPLE;
input showBreakoutSignals = {default "No", "On FullK", "On FullD", "On FullK & FullD"};
# ########################################################
#Using GlobalColors makes the colors modifiable
DefineGlobalColor("maxxed", CreateColor(50, 200, 255)) ;
DefineGlobalColor("rising", CreateColor(0, 165, 0)) ;
DefineGlobalColor("bear", CreateColor(225, 0, 0)) ;
DefineGlobalColor("pretrend", CreateColor (200, 125, 255)) ;
# ########################################################
def RSI = RSI(price = RSI_price, length = RSI_length, averageType = RSI_average_type);
plot FullK = StochasticFull(over_bought, over_sold, KPeriod, DPeriod, RSI, RSI, RSI, slowing_period, averageType).FullK;
plot FullD = StochasticFull(over_bought, over_sold, KPeriod, DPeriod, RSI, RSI, RSI, slowing_period, averageType).FullD;
#RSI> RSI[1] this statement is saying if the current candle is greater than the previous candle
#that is what [1] denotes. Thus defining uptick. The same is then done for downticks.
RSI.AssignValueColor(
if RSI> over_bought then GlobalColor("maxxed") else
if RSI< OverSold then GlobalColor("pretrend") else
if RSI> RSI[1] then GlobalColor("rising")
else GlobalColor("bear"));
RSI.SetLineWeight(3);
# ########################################################
# ########################################################
plot OverBought = over_bought;
plot OverSold = OverSold;
plot UpArrow = if RSI crosses above OverSold then OverSold else Double.NaN;
plot DownArrow = if RSI crosses below OverBought then OverBought else Double.NaN;
DefineGlobalColor("OBcolor", CreateColor(171, 171, 225)) ;
DefineGlobalColor("OScolor", CreateColor(220, 220, 128)) ;
OverBought.SetDefaultColor(GlobalColor("OBcolor"));
OverSold.SetDefaultColor(GlobalColor("OScolor"));
UpArrow.SetPaintingStrategy(PaintingStrategy.ARROW_UP);
DownArrow.SetPaintingStrategy(PaintingStrategy.ARROW_DOWN);
UpArrow.SetDefaultColor(color.dark_green);
DownArrow.SetDefaultColor(color.dark_red);
def upK = FullK crosses above OverSold;
def upD = FullD crosses above OverSold;
def downK = FullK crosses below OverBought;
def downD = FullD crosses below OverBought;
plot UpSignal;
plot DownSignal;
switch (showBreakoutSignals) {
case "No":
UpSignal = Double.NaN;
DownSignal = Double.NaN;
case "On FullK":
UpSignal = if upK then OverSold else Double.NaN;
DownSignal = if downK then OverBought else Double.NaN;
case "On FullD":
UpSignal = if upD then OverSold else Double.NaN;
DownSignal = if downD then OverBought else Double.NaN;
case "On FullK & FullD":
UpSignal = if upK or upD then OverSold else Double.NaN;
DownSignal = if downK or downD then OverBought else Double.NaN;
}
UpSignal.setHiding(showBreakoutSignals == showBreakoutSignals."No");
DownSignal.setHiding(showBreakoutSignals == showBreakoutSignals."No");
FullK.SetDefaultColor(GetColor(5));
FullD.SetDefaultColor(GetColor(0));
OverBought.SetDefaultColor(GetColor(1));
OverSold.SetDefaultColor(GetColor(1));
UpSignal.SetDefaultColor(Color.UPTICK);
UpSignal.SetPaintingStrategy(PaintingStrategy.ARROW_UP);
DownSignal.SetDefaultColor(Color.DOWNTICK);
DownSignal.SetPaintingStrategy(PaintingStrategy.ARROW_DOWN);
# ########################################################
# The same logic that was used in coloring the plot can be used in labels
AddLabel(show_label,
if RSI> over_bought then "RSI maxxed" else
if RSI< OverSold; then "RSI pre-trend" else
if RSI> RSI[1] then "RSI Trending " +round(RSI,2)
else "RSI Bear " +round(RSI,2) ,
if RSI> over_bought then GlobalColor("maxxed") else
if RSI< OverSold; and RSI>RSI[1] then GlobalColor("pretrend") else
if RSI> RSI[1] then GlobalColor("rising")
else GlobalColor("bear"));
AddCloud(if RSI >= over_bought then RSI else Double.NaN, over_bought,
GlobalColor("maxxed"), GlobalColor("maxxed"));
AddCloud(if RSI <= OverSold; then OverSold; else Double.NaN, RSI,
GlobalColor("pretrend"), GlobalColor("pretrend"));
# ########################################################
@serj1 You can modify this to your use.
StochRSI Color Code Key:
.png")
StochRSI Study & Label study link: http://tos.mx/XVasLl6 Click here for --> Easiest way to load shared links
.png")
StochRSI WatchList watchlist link: http://tos.mx/O4LrFzA

StochRSI Study & Label Script
StochRSI WatchList Script
StochRSI Color Code Key:
StochRSI Study & Label study link: http://tos.mx/XVasLl6 Click here for --> Easiest way to load shared links
StochRSI WatchList watchlist link: http://tos.mx/O4LrFzA
StochRSI Study & Label Script
Ruby:
# TOS StochRSI
input show_label = yes ;
input price = close ;
input OB = 75 ;
input OS = 35 ;
# ########################################################
#Using GlobalColors makes the colors modifiable
DefineGlobalColor("maxxed", CreateColor(50, 200, 255)) ;
DefineGlobalColor("rising",  CreateColor(0, 165, 0)) ;
DefineGlobalColor("bear",  CreateColor(225, 0, 0)) ;
DefineGlobalColor("pretrend", CreateColor (200, 125, 255)) ;
# ########################################################

Plot StochRSI = reference StochRSI("rsi length" = 14, "over bought" = 80, "over sold" = 20, "rsi average type" = "WILDERS", "rsi price" = close, "k period" = 14, "d period" = 3, "slowing period" = 1, "average type" = "SIMPLE", "show breakout signals" = "No")."Fullk" ;
# ########################################################
#StochRSI > StochRSI [1] this statement is saying if the current candle is greater than the previous candle
#that is what [1] denotes. Thus defining uptick. The same is then done for downticks.
StochRSI .AssignValueColor(
if StochRSI > OB then GlobalColor("maxxed") else
if StochRSI < OS then GlobalColor("pretrend") else
if StochRSI > StochRSI [1] then GlobalColor("rising")
     else GlobalColor("bear"));
StochRSI .SetLineWeight(3);
# ########################################################
# The same logic that was used in coloring the plot can be used in labels
AddLabel(show_label,
         if StochRSI > OB then "maxxed" else
         if StochRSI < OS and StochRSI >StochRSI [1] then "pre-trend" else
         if StochRSI < OS and StochRSI <=StochRSI [1] then "bottomed" else
         if StochRSI > StochRSI [1] then "Trending " +round(StochRSI ,1)
              else "Bear " +round(StochRSI ,1) );
AssignBackgroundColor(
         if StochRSI > OB then CreateColor(50, 200, 255) else
         if StochRSI < OS and StochRSI >StochRSI [1] then CreateColor (200, 125, 255) else
         if StochRSI < OS and StochRSI <=StochRSI [1] then color.orange else
         if StochRSI > StochRSI [1] then CreateColor(0, 165, 0)
              else CreateColor(225, 0, 0));
# ########################################################
Last edited:
I am trying to customize a StochRSI indicator script to use in a watchlist column that change color when it goes to overbought and oversold.
I was using the script in the thread below but I can't get it work.
https://usethinkscript.com/threads/stochrsi.6757/#post-75245
NOTE: I already have a customized StochRSI indicator that I use with the charts. Now I am just trying to incorporate OverBought and OverSold signals column into my watchlist.
Here is the code I have so far:
I am getting the following errors:
Incompatible parameter: "" at 14:6
Expected class com.devexperts.tos.thinkscript.data.CustomColor at 16:6
Incompatible parameter: "" at 14:6
Expected class com.devexperts.tos.thinkscript.data.CustomColor at 16:6
I was using the script in the thread below but I can't get it work.
https://usethinkscript.com/threads/stochrsi.6757/#post-75245
NOTE: I already have a customized StochRSI indicator that I use with the charts. Now I am just trying to incorporate OverBought and OverSold signals column into my watchlist.
Here is the code I have so far:
Code:
declare lower;

def over_bought = 80;
def over_sold = 20;
def KPeriod = 20;
def DPeriod = 12;
def priceH = high;
def priceL = low;
def priceC = close;
def averageType = AverageType.WILDERS;

def SlowK = reference StochasticFull(over_bought, over_sold, KPeriod, DPeriod, priceH, priceL, priceC, 3, averageType).FullK;

plot data = SlowK;

data.AssignValueColor(if SlowK > over_bought then color.green else "");

data.AssignValueColor(if SlowK < over_sold then color.red else "");
I am getting the following errors:
Incompatible parameter: "" at 14:6
Expected class com.devexperts.tos.thinkscript.data.CustomColor at 16:6
Incompatible parameter: "" at 14:6
Expected class com.devexperts.tos.thinkscript.data.CustomColor at 16:6
Last edited:
I am trying to customize a StochRSI indicator script to use in a watchlist column that change color when it goes to overbought and oversold.
I was using the script in the thread below but I can't get it work.
https://usethinkscript.com/threads/stochrsi.6757/#post-75245
NOTE: I already have a customized StochRSI indicator that I use with the charts. Now I am just trying to incorporate OverBought and OverSold signals column into my watchlist.
Here is the code I have so far:
Code:declare lower; def over_bought = 80; def over_sold = 20; def KPeriod = 20; def DPeriod = 12; def priceH = high; def priceL = low; def priceC = close; def averageType = AverageType.WILDERS; def SlowK = reference StochasticFull(over_bought, over_sold, KPeriod, DPeriod, priceH, priceL, priceC, 3, averageType).FullK; plot data = SlowK; data.AssignValueColor(if SlowK > over_bought then color.green else ""); data.AssignValueColor(if SlowK < over_sold then color.red else "");
I am getting the following errors:
Incompatible parameter: "" at 14:6
Expected class com.devexperts.tos.thinkscript.data.CustomColor at 16:6
Incompatible parameter: "" at 14:6
Expected class com.devexperts.tos.thinkscript.data.CustomColor at 16:6
This will color the background of your watchlist as you wanted and show the Stochastic value in white);
There was a minor formatting error in the above script with the averagetype.
The following picture shows how the code would display in a watchlist as a red cell.
 Ruby:
Ruby:declare lower; def over_bought = 80; def over_sold = 20; def KPeriod = 20; def DPeriod = 12; def priceH = high; def priceL = low; def priceC = close; input averagetype = averagetype.WILDERS; plot SlowK = reference StochasticFull("over bought" = over_bought, "over sold" = over_sold, "k period" = kperiod, "d period" = dperiod, "price h" = priceh, "price l" = pricel, "price c" = pricec, "average type" = averagetype); plot data = SlowK; data.setdefaultColor(color.white); assignbackgroundColor(if SlowK crosses above over_bought then Color.GREEN else if SlowK crosses below over_sold then Color.RED else color.current);
Hello,
I created a custom column in the watch list. I am trying to get a column to display StockRSI value for 20 min timeframe. For some reason, what is displayed in the watchlist column doesn't match the indicator on the chart. Can't figure out what I am doing wrong. The settings on the chart are same as settings on the watchlist column.
Thanks
Chart StochRSI settings.

Custom Column Settings for StochRSI. Next to the column name I did select the 20Min option.


The difference.

I created a custom column in the watch list. I am trying to get a column to display StockRSI value for 20 min timeframe. For some reason, what is displayed in the watchlist column doesn't match the indicator on the chart. Can't figure out what I am doing wrong. The settings on the chart are same as settings on the watchlist column.
Thanks
Chart StochRSI settings.
Custom Column Settings for StochRSI. Next to the column name I did select the 20Min option.
The difference.
Attachments
Hi there. I am trying to code the slope of the Kperiod in the StochRSI. I found a lot of help here from recent posts on it but I am having some trouble. Thee trouble is I am assuming you can't leave out the RSI Length as it is an integral part of the indicator. What am I coding wrong here?
Here is the script I am trying to complete.
declare lower;
input RSILength = 12;
input price = close;
input length =12;
input displace =0;
input KPeriodLength = 5;
input price = close;
input length = 5;
input displace = 0;
def RSILength = (ExpAverage(price[-displace], length));
def KPeriodAvg = (SimpleMovingAvg(price[-displace], length));
plot RSILength = RSILength(length = RSILength);
plot RSIAvg = Average(RSI, RSILength);
plot KPeriod = KPeriod(length = KPeriodLength);
plot KPeriodAvg = Average(KPeriod, KPeriodLength);
KPeriod.SetDefaultColor(GetColor(9));
KPeriodAvg.SetDefaultColor(GetColor(8));
def KPeriodSlope = if KPeriod > KPeriod[1] then 1 else 0 ; # 1 is UP, 0 is DOWN
AddChartBubble(SecondsFromTime(1500) >= 0 and SecondsFromTime(1500) <= 59 , high, if KPeriodSLope == 1 then "KPeriod - Slope UP" else "KPeriod - Slope DOWN", if KPeriodSlope == 1 then Color.GREEN else Color.RED);
#For testing/verification
AddChartBubble(SecondsFromTime(1500) >= 0 and SecondsFromTime(1500) <= 59 , high, "KPeriod Fast: " + KPeriod, Color.GREEN);
AddChartBubble(SecondsFromTime(1500) >= 0 and SecondsFromTime(1500) <= 59, high, "Previous KPeriod Fast: " + KPeriod[1], Color.GREEN);
Last edited by a moderator:
Hi there. I am trying to code the slope of the Kperiod in the StochRSI. I found a lot of help here from recent posts on it but I am having some trouble. Thee trouble is I am assuming you can't leave out the RSI Length as it is an integral part of the indicator. What am I coding wrong here?
Here is the script I am trying to complete.
declare lower;
input RSILength = 12;
input price = close;
input length =12;
input displace =0;
input KPeriodLength = 5;
input price = close;
input length = 5;
input displace = 0;
def RSILength = (ExpAverage(price[-displace], length));
def KPeriodAvg = (SimpleMovingAvg(price[-displace], length));
plot RSILength = RSILength(length = RSILength);
plot RSIAvg = Average(RSI, RSILength);
plot KPeriod = KPeriod(length = KPeriodLength);
plot KPeriodAvg = Average(KPeriod, KPeriodLength);
KPeriod.SetDefaultColor(GetColor(9));
KPeriodAvg.SetDefaultColor(GetColor(8));
def KPeriodSlope = if KPeriod > KPeriod[1] then 1 else 0 ; # 1 is UP, 0 is DOWN
AddChartBubble(SecondsFromTime(1500) >= 0 and SecondsFromTime(1500) <= 59 , high, if KPeriodSLope == 1 then "KPeriod - Slope UP" else "KPeriod - Slope DOWN", if KPeriodSlope == 1 then Color.GREEN else Color.RED);
#For testing/verification
AddChartBubble(SecondsFromTime(1500) >= 0 and SecondsFromTime(1500) <= 59 , high, "KPeriod Fast: " + KPeriod, Color.GREEN);
AddChartBubble(SecondsFromTime(1500) >= 0 and SecondsFromTime(1500) <= 59, high, "Previous KPeriod Fast: " + KPeriod[1], Color.GREEN);
See if this helps if you want to make any changes.
The following code uses the StochRSI code's FullK to define your 'slope'. Your code was just using the input values for the slope of the FullK rather than the plot FullK. I changed the input values to what you had in your code.
I like that you set up testing bubbles. It is a great practice when coding.
 Ruby:
Ruby:input over_bought = 80; input over_sold = 20; input RSI_average_type = AverageType.eXPONENTIAL; input RSI_price = close; input KPeriod = 5; input DPeriod = 3; input slowing_period = 1; input averageType = AverageType.SIMPLE; def RSI = RSI(price = RSI_price, length = RSI_length, averageType = RSI_average_type); plot FullK = StochasticFull(over_bought, over_sold, KPeriod, DPeriod, RSI, RSI, RSI, slowing_period, averageType).FullK; plot FullD = StochasticFull(over_bought, over_sold, KPeriod, DPeriod, RSI, RSI, RSI, slowing_period, averageType).FullD; plot OverBought = over_bought; plot OverSold = over_sold; def KPeriodSlope = if FullK > FullK[1] then 1 else 0 ; # 1 is UP, 0 is DOWN AddChartBubble(SecondsFromTime(1500) >= 0, FullK, if KPeriodSLope == 1 then "KPeriod - Slope UP" else "KPeriod - Slope DOWN", if KPeriodSlope == 1 then Color.GREEN else Color.RED); #For testing/verification input testing = no; AddChartBubble(testing and SecondsFromTime(1500) >= 0 , FullK, "KPeriod Fast: " + FullK, Color.GREEN); AddChartBubble(testing and SecondsFromTime(1500) >= 0 , FullK, "Previous KPeriod Fast: " + FullK[1], Color.GREEN);
magnetar513
New member
For testing slopes, this example that is provided on the TDA website using the Atan() function has proved useful in some of my code:
The Isascending() and Isdescending() functions are also helpful.
declare lower;
input length = 3;
def avg = Average(close, length);
def height = avg - avg[length];
plot "Angle, deg" = ATan(height/length) * 180 / Double.Pi;
The code calculates the angle of slope of the simple moving average with the given length. The angle itself is calculated using the ATan function.
Last edited:
Good morning,
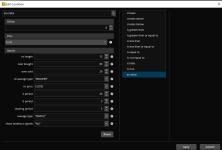
Trying to incorporate StochRSI scan into my parameters and not quite getting it right using the wizard. Hoping someone can help
My settings:
RSI Length: 14
Overbought: 70
Oversold: 30
RSI avg type: Wilders
RSI Price: close
k period: 5
d period: 3
slowing period: 3
Avg type simple
Looking for two separate scan parameters:
Thank you
Trying to incorporate StochRSI scan into my parameters and not quite getting it right using the wizard. Hoping someone can help
My settings:
RSI Length: 14
Overbought: 70
Oversold: 30
RSI avg type: Wilders
RSI Price: close
k period: 5
d period: 3
slowing period: 3
Avg type simple
Looking for two separate scan parameters:
- When the %K line crosses over the %D between 30 and 55 line AND the %k is currently over 50
- When the %K line crosses BELOW the %D above the 70
Thank you
Scan 1: When the %K line crosses over the %D between 30 and 55 line AND the %k is currently over 50Good morning,
Trying to incorporate StochRSI scan into my parameters and not quite getting it right using the wizard. Hoping someone can help
Looking for two separate scan parameters:
aggregation period: 5 minutes
- When the %K line crosses over the %D between 30 and 55 line AND the %k is currently over 50
- When the %K line crosses BELOW the %D above the 70
Thank you
Ruby:
# ToS StochRSI Scan Buyable Zone
# requested by stormy77
def StochRSI_K = reference StochRSI("rsi length" = 14, "over bought" = 70, "over sold" = 30, "rsi average type" = "WILDERS" ,
                            "rsi price" = CLOSE, "k period" = 5, "d period" = 3, "slowing period" = 3, "average type" = "SIMPLE")."FullK" ;
def StochRSI_D = reference StochRSI("rsi length" = 14, "over bought" = 70, "over sold" = 30, "rsi average type" = "WILDERS" ,
                            "rsi price" = CLOSE, "k period" = 5, "d period" = 3, "slowing period" = 3, "average type" = "SIMPLE")."FullD";

plot scan1 = StochRSI_K crosses above StochRSI_D and StochRSI_D>30 and StochRSI_D<55 and StochRSI_K>50 ;Scan2: When the %K line crosses BELOW the %D above the 70
Ruby:
# ToS StochRSI Scan Sellable Zone
# requested by stormy77
def StochRSI_K = reference StochRSI("rsi length" = 14, "over bought" = 70, "over sold" = 30, "rsi average type" = "WILDERS" ,
                            "rsi price" = CLOSE, "k period" = 5, "d period" = 3, "slowing period" = 3, "average type" = "SIMPLE")."FullK" ;
def StochRSI_D = reference StochRSI("rsi length" = 14, "over bought" = 70, "over sold" = 30, "rsi average type" = "WILDERS" ,
                            "rsi price" = CLOSE, "k period" = 5, "d period" = 3, "slowing period" = 3, "average type" = "SIMPLE")."FullD";

plot scan2 = StochRSI_K crosses below StochRSI_D and StochRSI_K>70 ;I modified @MerryDay code for a StochRSI Label. The original wasn't working for me.
Rich (BB code):
# TOS StochRSI Label
input show_label = yes;
input price = close;
input OB = 75;
input OS = 35;

# Define Global Colors
DefineGlobalColor("maxxed", CreateColor(50, 200, 255));
DefineGlobalColor("rising",  CreateColor(0, 165, 0));
DefineGlobalColor("bear",  CreateColor(225, 0, 0));
DefineGlobalColor("pretrend", CreateColor (200, 125, 255));

# Calculate StochRSI
def StochRSI = reference StochRSI("rsi length" = 14, "over bought" = 80, "over sold" = 20, "rsi average type" = "WILDERS", "rsi price" = close, "k period" = 14, "d period" = 3, "slowing period" = 1, "average type" = "SIMPLE", "show breakout signals" = "No")."Fullk";

# Add Label with Conditional Color
AddLabel(show_label,
         if StochRSI > OB then "StochRSI:maxxed" else
         if StochRSI < OS and StochRSI > StochRSI[1] then "StochRSIre-trend" else
         if StochRSI < OS and StochRSI <= StochRSI[1] then "StochRSI:bottomed" else
         if StochRSI > StochRSI[1] then "StochRSI:Trending " + round(StochRSI, 1)
              else "StochRSI:Bear " + round(StochRSI, 1),
         if StochRSI > OB then GlobalColor("maxxed") else
         if StochRSI < OS and StochRSI > StochRSI[1] then GlobalColor("pretrend") else
         if StochRSI < OS and StochRSI <= StochRSI[1] then color.orange else
         if StochRSI > StochRSI[1] then GlobalColor("rising")
              else GlobalColor("bear"));
prancelot
New member
Hi!
I was wondering if anyone could help me code the StochasticRSI to include a multi-timeframe option? Any help would be much appreciated! I went ahead and attached the StochRSI code in case that helps.
I was wondering if anyone could help me code the StochasticRSI to include a multi-timeframe option? Any help would be much appreciated! I went ahead and attached the StochRSI code in case that helps.
declare lower;
input RSI_length = 14;
input over_bought = 80;
input over_sold = 20;
input RSI_average_type = AverageType.WILDERS;
input RSI_price = close;
input KPeriod = 14;
input DPeriod = 3;
input slowing_period = 1;
input averageType = AverageType.SIMPLE;
input showBreakoutSignals = {default "No", "On FullK", "On FullD", "On FullK & FullD"};
def RSI = RSI(price = RSI_price, length = RSI_length, averageType = RSI_average_type);
plot FullK = StochasticFull(over_bought, over_sold, KPeriod, DPeriod, RSI, RSI, RSI, slowing_period, averageType).FullK;
plot FullD = StochasticFull(over_bought, over_sold, KPeriod, DPeriod, RSI, RSI, RSI, slowing_period, averageType).FullD;
plot OverBought = over_bought;
plot OverSold = over_sold;
| Thread starter | Similar threads | Forum | Replies | Date |
|---|---|---|---|---|
| K | stochRSI 3 EMA Dashboard For ThinkOrSwim | Custom | 3 | |
| H | Repaints MTF StochRSI For ThinkOrSwim | Custom | 9 | |
| C | Next Earnings Column / Label For ThinkOrSwim | Custom | 26 | |
| P | Up/Down Ratio Label For ThinkOrSwim | Custom | 0 | |
| J | Study Name Label For ThinkOrSwim | Custom | 0 |
Similar threads
Not the exact question you're looking for?
Start a new thread and receive assistance from our community.
87k+
Posts
412
Online
Similar threads
Similar threads
The Market Trading Game Changer
Join 2,500+ subscribers inside the useThinkScript VIP Membership Club
- Exclusive indicators
- Proven strategies & setups
- Private Discord community
- ‘Buy The Dip’ signal alerts
- Exclusive members-only content
- Add-ons and resources
- 1 full year of unlimited support
Frequently Asked Questions
What is useThinkScript?
useThinkScript is the #1 community of stock market investors using indicators and other tools to power their trading strategies. Traders of all skill levels use our forums to learn about scripting and indicators, help each other, and discover new ways to gain an edge in the markets.
How do I get started?
We get it. Our forum can be intimidating, if not overwhelming. With thousands of topics, tens of thousands of posts, our community has created an incredibly deep knowledge base for stock traders. No one can ever exhaust every resource provided on our site.
If you are new, or just looking for guidance, here are some helpful links to get you started.
- The most viewed thread:
https://usethinkscript.com/threads/repainting-trend-reversal-for-thinkorswim.183/ - Our most popular indicator:
https://usethinkscript.com/threads/buy-the-dip-indicator-for-thinkorswim.3553/ - Answers to frequently asked questions:
https://usethinkscript.com/threads/answers-to-commonly-asked-questions.6006/
What are the benefits of VIP Membership?
VIP members get exclusive access to these proven and tested premium indicators: Buy the Dip, Advanced Market Moves 2.0, Take Profit, and Volatility Trading Range. In addition, VIP members get access to over 50 VIP-only custom indicators, add-ons, and strategies, private VIP-only forums, private Discord channel to discuss trades and strategies in real-time, customer support, trade alerts, and much more. Learn all about VIP membership here.
How can I access the premium indicators?
To access the premium indicators, which are plug and play ready, sign up for VIP membership here.