stochRSI 3 EMA Dashboard For ThinkOrSwim

kaiso

New member
VIP
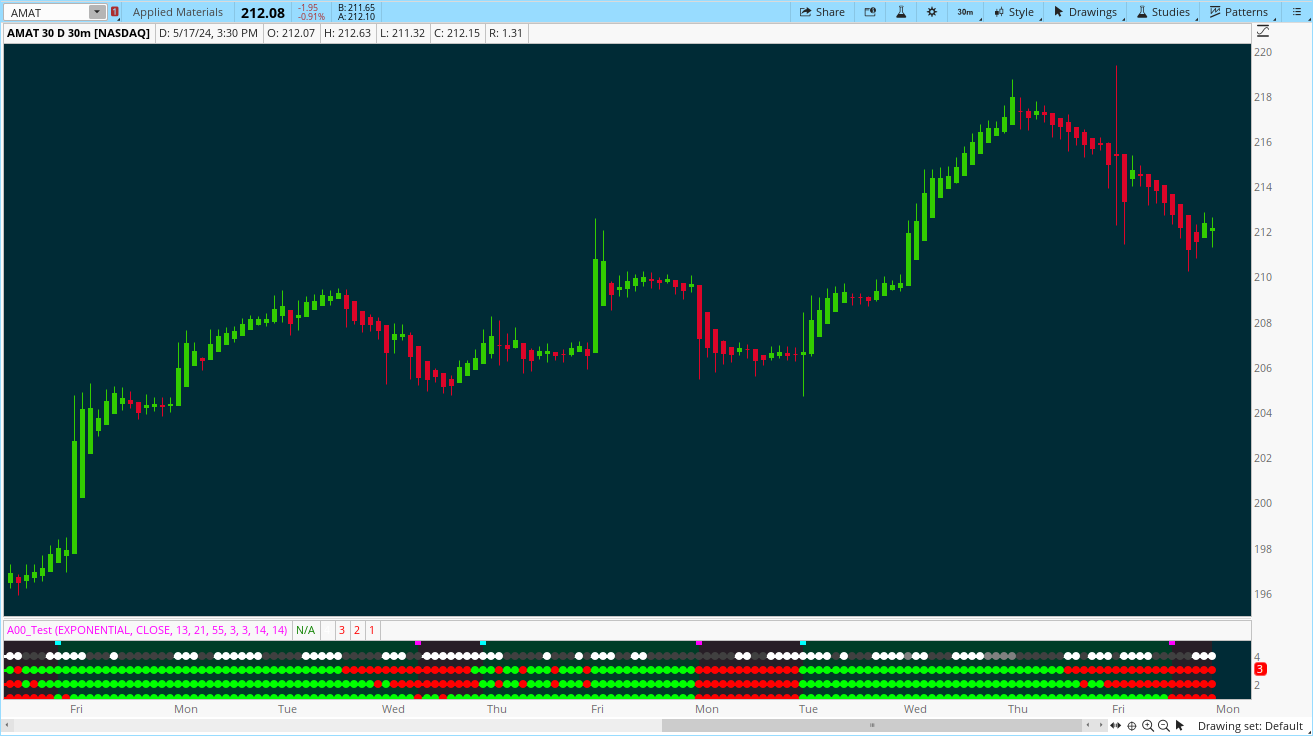
This stochRSI 3 EMA Dashboard is labeled Trend Meter on Tradingview
The author states:
This is a useful trend analysis tool.
The script consists of 3 EMAs, all weighted against the same baseline moving average to give you an overview of the trend. My meter shows the status of each EMA; either up (green) or down (red). When you see two of the same colour vertically aligned then the trade will most likely go in that direction. When all three are the same colour then it's a certainty.

The top row represents the stochastic RSI direction to further validate the EMA signals.

zA6H8Nm.png


Please if possible, convert EMA Trend Meter
https://www.tradingview.com/script/KFLuglJc-EMA-Trend-Meter/
code is down in the comments section
 
Last edited by a moderator:
Please if possible, convert EMA Trend Meter
https://www.tradingview.com/script/KFLuglJc-EMA-Trend-Meter/
code is down in the comments section

//@version=5
indicator("EMA Trend Meter")
import TradingView/ta/7
len1 = input(13, 'Length EMA1')
len2 = input(21, 'Length EMA1')
len3 = input(55, 'Length EMA1')
K_ = input(3, 'Smooth K')
D_ = input(3, 'Smooth D')
L1 = input(14, 'RSI Length')
L2 = input(14, 'STO Length')

EMA0 = ta.ema(close, 1)
EMA1 = ta.ema(close, len1)
EMA2 = ta.ema(close, len2)
EMA3 = ta.ema(close, len3)

[a, b] =ta.stochRsi(L1, L2, K_, D_, close)
Bull1 = EMA1 < EMA0
Bull2 = EMA2 < EMA0
Bull3 = EMA3 < EMA0

plot(30, 'S_R' , color = a > b ? color.gray: a < b ? color.black : na, linewidth= 4, style= plot.style_circles)
plot(20, 'EMA1', color = Bull1 ? color.green: color.red, linewidth= 4, style= plot.style_circles)
plot(10, 'EMA2', color = Bull2 ? color.green: color.red, linewidth= 4, style= plot.style_circles)
plot(0 , 'EMA3', color = Bull3 ? color.green: color.red, linewidth= 4, style= plot.style_circles)
there is much better trend meter in this forum. check the below:

https://usethinkscript.com/threads/trend-meter-for-thinkorswim.13179/

https://usethinkscript.com/threads/...xxer-cci-velocity-loxx-for-thinkorswim.14670/

however, check I wrote the requested script for you below:

CSS:
# Trend Meter
# Sam4Cok@Samer800    - 05/2024, Request from UseThinkScript.com member

declare lower;

input MovingAvgType = AverageType.EXPONENTIAL;
input src = close;
input MovAvgLength1 = 13;
input MovAvgLength2 = 21;
input MovAvgLength3 = 55;
input SmoothK = 3;
input SmoothD = 3;
input rsiLength = 14;
input stochLength = 14;

def na = Double.NaN;
def last = isNaN(Close);
def pos = Double.POSITIVE_INFINITY;
def neg = Double.NEGATIVE_INFINITY;
def EMA0 = MovingAverage(MovingAvgType, src, 1);
def EMA1 = MovingAverage(MovingAvgType, src, MovAvgLength1);
def EMA2 = MovingAverage(MovingAvgType, src, MovAvgLength2);
def EMA3 = MovingAverage(MovingAvgType, src, MovAvgLength3);

# stoch(source, high, low, length) =>
script stoch {
    input src = close;
    input h = high;
    input l = low;
    input len = 14;
    def stoch = 100 * (src - Lowest(l, len)) / (Highest(h, len) - Lowest(l, len));
    plot return = stoch;
}

def rsi1 = RSI(PRICE = src, LENGTH = rsiLength);
def k = Average(stoch(rsi1, rsi1, rsi1, stochLength), SmoothK);
def d = Average(k, SmoothD);

def STOBull = k > d;
def STOBear = k < d;
def Bull1 = EMA1 < EMA0;
def Bull2 = EMA2 < EMA0;
def Bull3 = EMA3 < EMA0;
def Bear1 = EMA1 > EMA0;
def Bear2 = EMA2 > EMA0;
def Bear3 = EMA3 > EMA0;

def sigUp = STOBull and Bull1 and Bull2 and Bull3;
def SigDn = STOBear and Bear1 and Bear2 and Bear3;
def col = if sigUp then 1 else if SigDn then -1 else col[1];

plot Signal = if (col Crosses Above 0) or (col Crosses Below 0) then 5 else na;
plot S_R = if last then na else 4;
plot MovAvg1 = if last then na else 3;
plot MovAvg2 = if last then na else 2;
plot MovAvg3 = if last then na else 1;
Signal.SetLineWeight(3);
S_R.SetLineWeight(3);
MovAvg1.SetLineWeight(3);
MovAvg2.SetLineWeight(3);
MovAvg3.SetLineWeight(3);
Signal.SetPaintingStrategy(PaintingStrategy.SQUARES);
S_R.SetPaintingStrategy(PaintingStrategy.LINE_VS_POINTS);
MovAvg1.SetPaintingStrategy(PaintingStrategy.LINE_VS_POINTS);
MovAvg2.SetPaintingStrategy(PaintingStrategy.LINE_VS_POINTS);
MovAvg3.SetPaintingStrategy(PaintingStrategy.LINE_VS_POINTS);
Signal.AssignValueColor(if sigUp then Color.CYAN else Color.MAGENTA);
S_R.AssignValueColor(if STOBull then Color.WHITE else if STOBear then Color.DARK_GRAY else Color.GRAY);
MovAvg1.AssignValueColor(if Bull1 then Color.GREEN else if Bear1 then Color.RED else Color.DARK_ORANGE);
MovAvg2.AssignValueColor(if Bull2 then Color.GREEN else if Bear2 then Color.RED else Color.DARK_ORANGE);
MovAvg3.AssignValueColor(if Bull3 then Color.GREEN else if Bear3 then Color.RED else Color.DARK_ORANGE);

def bg = col;
AddCloud(if bg>0 then pos else neg, if bg>0 then neg else pos, Color.DARK_GREEN, Color.DARK_RED);

#-- END of CODE
 
Thank you. For some reason the bottom line (1) is partially visible and has to be scrolled up. Is there a way I can have it in the pane without having to scroll and make it visible?

Never mind. Went in to code and figured it out. Thanks again.
 
Last edited:
Thank you. For some reason the bottom line (1) is partially visible and has to be scrolled up. Is there a way I can have it in the pane without having to scroll and make it visible?

Never mind. Went in to code and figured it out. Thanks again.
try to add this at the beginning of the code:

declare zerobase;
 

Join useThinkScript to post your question to a community of 21,000+ developers and traders.

Similar threads

Not the exact question you're looking for?

Start a new thread and receive assistance from our community.

87k+ Posts
573 Online
Create Post

Similar threads

Similar threads

The Market Trading Game Changer

Join 2,500+ subscribers inside the useThinkScript VIP Membership Club
  • Exclusive indicators
  • Proven strategies & setups
  • Private Discord community
  • ‘Buy The Dip’ signal alerts
  • Exclusive members-only content
  • Add-ons and resources
  • 1 full year of unlimited support

Frequently Asked Questions

What is useThinkScript?

useThinkScript is the #1 community of stock market investors using indicators and other tools to power their trading strategies. Traders of all skill levels use our forums to learn about scripting and indicators, help each other, and discover new ways to gain an edge in the markets.

How do I get started?

We get it. Our forum can be intimidating, if not overwhelming. With thousands of topics, tens of thousands of posts, our community has created an incredibly deep knowledge base for stock traders. No one can ever exhaust every resource provided on our site.

If you are new, or just looking for guidance, here are some helpful links to get you started.

What are the benefits of VIP Membership?
VIP members get exclusive access to these proven and tested premium indicators: Buy the Dip, Advanced Market Moves 2.0, Take Profit, and Volatility Trading Range. In addition, VIP members get access to over 50 VIP-only custom indicators, add-ons, and strategies, private VIP-only forums, private Discord channel to discuss trades and strategies in real-time, customer support, trade alerts, and much more. Learn all about VIP membership here.
How can I access the premium indicators?
To access the premium indicators, which are plug and play ready, sign up for VIP membership here.
Back
Top