Stepped Heiken Ashi Moving Average w/ Jurik Filtering For ThinkOrSwim

MikeLikesAnacottSteel

New member
VIP
Is there any way we can get a Stepped Heiken Ashi Moving Average MTF/T3 study converted from TradingView?
https://www.tradingview.com/script/...n-Ashi-Moving-Average-w-Jurik-Filtering-Loxx/
The 1st attached image shows the general application as shown on TradingView. The 2nd image is from an MT4 chart that shows the different size in the 'ribbons' based upon the different time frames (I wasn't able to find an example of the multiple ribbons on TradingView for the study) - the chart looks a little busy, but it's only the red/blue ribbons that I'm referencing. The last and 3rd image is the lower study to show buy/sell alignments w/ the upper ribbons/study.
NMiUBtY.png


vDdJdKz.png
9XZouks.png
 

Attachments

  • vDdJdKz.png
    vDdJdKz.png
    611.3 KB · Views: 457
Last edited by a moderator:

Join useThinkScript to post your question to a community of 21,000+ developers and traders.

Is there any way we can get a Stepped Heiken Ashi Moving Average MTF/T3 study converted from TradingView?
https://www.tradingview.com/script/...n-Ashi-Moving-Average-w-Jurik-Filtering-Loxx/

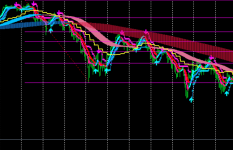
I provided the code below that I found. The 1st attached image shows the general application as shown on TradingView. The 2nd image is from an MT4 chart that shows the different size in the 'ribbons' based upon the different time frames (I wasn't able to find an example of the multiple ribbons on TradingView for the study) - the chart looks a little busy, but it's only the red/blue ribbons that I'm referencing. The last and 3rd image is the lower study to show buy/sell alignments w/ the upper ribbons/study.


// This source code is subject to the terms of the Mozilla Public License 2.0 at https://mozilla.org/MPL/2.0/
// © loxx

//@version=5
indicator("Stepped Heiken Ashi Moving Average w/ Jurik Filtering [Loxx]",
shorttitle = "SHAMAJF [Loxx]",
overlay = true,
timeframe="",
timeframe_gaps = true)

import loxx/loxxexpandedsourcetypes/3
import loxx/loxxjuriktools/1

calcBaseUnit() =>
bool isForexSymbol = syminfo.type == "forex"
bool isYenPair = syminfo.currency == "JPY"
float result = isForexSymbol ? isYenPair ? 0.01 : 0.0001 : syminfo.mintick

_declen()=>
mtckstr = str.tostring(syminfo.mintick)
da = str.split(mtckstr, ".")
temp = array.size(da)
dlen = 0.
if syminfo.mintick < 1
dstr = array.get(da, 1)
dlen := str.length(dstr)
dlen

greencolor = #2DD204
redcolor = #D2042D


per= input.int(13, "Period", group = "Basic Settings")
step = input.int(1, "Step", group = "Basic Settings", minval = 1)
better = input.bool(false, "Better HA?", group = "Basic Settings")
jurik = input.bool(true, "Juirk Filtered?", group = "Basic Settings")
jper= input.int(34, "Juirk Length", group = "Basic Settings")
jphs= input.int(0, "Juirk Phase", group = "Basic Settings")

colorbars = input.bool(false, "Color bars?", group= "UI Options")
showcandles = input.bool(false, "Show candles?", group= "UI Options")
showfill = input.bool(false, "Show fill?", group= "UI Options")

maOpen = 0.
maClose = 0.
maLow = 0.
maHigh =0.

if jurik
maOpen := loxxjuriktools.jurik_filt(open, jper, jphs)
maClose := loxxjuriktools.jurik_filt(close, jper, jphs)
maLow := loxxjuriktools.jurik_filt(low, jper, jphs)
maHigh := loxxjuriktools.jurik_filt(high, jper, jphs)

else
maOpen := ta.sma(open, per)
maClose := ta.sma(close, per)
maHigh := ta.sma(high, per)
maLow := ta.sma(low, per)

haClose = 0.

if better
if (maHigh != maLow)
haClose := (maOpen + maClose) / 2 + (((maClose - maOpen) / (maHigh - maLow)) * math.abs((maClose - maOpen) / 2))
else
haClose := (maOpen + maClose) / 2
else
haClose := (maOpen + maHigh + maLow + maClose) / 4

haOpen = 0.
haOpen := (nz(haOpen[1]) + nz(haClose[1]))/2
haHigh = math.max(maHigh, math.max(haOpen, haClose))
haLow = math.min(maOpen, math.min(haOpen, haClose))

color colorhigh = na
color colorlow = na

if (haOpen < haClose)
colorlow := color.fuchsia
colorhigh := color.yellow
else
colorlow := color.fuchsia
colorhigh := color.yellow

outLow = haLow
outHigh = haHigh

outOpen = haOpen
outClose = haClose


if (math.abs(outLow - nz(outLow[1])) < step * _declen() * calcBaseUnit())
outLow := nz(outLow[1])
if (math.abs(outHigh - nz(outHigh[1])) < step * _declen() * calcBaseUnit())
outHigh := nz(outHigh[1])
if (math.abs(outOpen - nz(outOpen[1])) < step * _declen() * calcBaseUnit())
outOpen := nz(outOpen[1])
if (math.abs(outClose - nz(outClose[1])) < step * _declen() * calcBaseUnit())
outClose := nz(outClose[1])

colorout = outClose > outOpen ? greencolor : redcolor
coloroutf = outClose > outOpen ? color.yellow : color.fuchsia

plotcandle(outOpen, outHigh, outLow, outClose, color = showcandles ? coloroutf : na, wickcolor = showcandles ? coloroutf : na)

l = plot(outLow, color = colorlow)
h = plot(outHigh, color = colorhigh)

fill(h, l, color = showfill ? color.new(coloroutf, 80) : na)

barcolor(colorbars ? colorout : na)


NMiUBtY.png


vDdJdKz.png
9XZouks.png
find below.
CSS:
#// This source code is subject to the terms of the Mozilla Public License 2.0 at https://mozilla.org/MPL/2.0/
#// © loxx
#indicator("Stepped Heiken Ashi Moving Average w/ Jurik Filtering [Loxx]",  shorttitle = "SHAMAJF [Loxx]",
# converted and modified by Sam4Cok@Samer800 - 01/2023
input HidePricePlot = no;
input colorbars = no;  # "Color bars?"
input showcandles = no;# "Show candles?"
input showfill = yes;  # "Show fill?"
input LineStyle = {"Average Line",Default "High&Low Lines", None};
input Period = 13;     # "Period"
input step = 1;        # "Step"
input better = no;     # "Better HA?"
input jurik = yes;     # "Juirk Filtered?"
input JuirkLength = 34;# "Juirk Length"
input jphs = 0;        # "Juirk Phase"
input ParabolicPercent = 0.2; # Parabolic Squeeze Percent
input transitionLine = no;

HidePricePlot(HidePricePlot);
def na = Double.NaN;
def Style = LineStyle==LineStyle."Average Line";
def StyleH = LineStyle==LineStyle."High&Low Lines";

script nz {
    input data  = close;
    input repl  = 0;
    def ret_val = if !isNaN(data) or data then data else repl;
    plot return = ret_val;
}
#jurik_filt(float src, int len, float phase) =>
script jurik_filt {
    input src = close;
    input len = 34;
    input phase = 0;
#    //static variales
    def volty;
    def avolty;
    def vsum;
    def bsmax;
    def bsmin;
    def kv;
    def pow2;
    def dVolty;
    def len1 = Max(Log(Sqrt(0.5 * (len - 1))) / Log(2.0) + 2.0, 0);
    def len2 = Sqrt(0.5 * (len - 1)) * len1;
    def pow1 = Max(len1 - 2.0, 0.5);
    def beta = 0.45 * (len - 1) / (0.45 * (len - 1) + 2);
    def div = 1.0 / (10.0 + 10.0 * (Min(Max(len - 10, 0), 100)) / 100);
    def phaseRatio = if phase < -100 then 0.5 else
                     if phase >  100 then 2.5 else 1.5 + phase * 0.01;
    def bet = len2 / (len2 + 1);
#    //Price volatility
    def del1 = CompoundValue(1, src - bsmax[1], 0);
    def del2 = CompoundValue(1, src - bsmin[1], 0);
    volty = if AbsValue(del1) > AbsValue(del2) then AbsValue(del1) else AbsValue(del2);
#    //Relative price volatility factor
    vsum   = CompoundValue(1, vsum[1] + div * (volty - volty[10]), 0);
    avolty = CompoundValue(1, avolty[1] + (2.0 / (Max(4.0 * len, 30) + 1.0)) * (vsum - avolty[1]), 0);
    def dVolt = if avolty > 0 then volty / avolty else 0;
    dVolty = Max(1, Min(Power(len1, 1.0 / pow1), dVolt));
#   //Jurik volatility bands
    pow2 = Power(dVolty, pow1);
    Kv   = Power(bet, Sqrt(pow2));
    bsmax = if del1 > 0 then src else src - Kv * del1;
    bsmin = if del2 < 0 then src else src - Kv * del2;
#    //Jurik Dynamic Factor
    def alpha = Power(beta, pow2);
#    //1st stage - prelimimary smoothing by adaptive EMA
    def jrkout;
    def ma1;
    def det0;
    def e2;
    ma1 = CompoundValue(1, (1 - alpha) * src + alpha * ma1[1], 0);
#    //2nd stage - one more prelimimary smoothing by Kalman filter
    det0 = CompoundValue(1, (src - ma1) * (1 - beta) + beta * det0[1], 0);
    def ma2 = ma1 + phaseRatio * det0;
#    //3rd stage - final smoothing by unique Jurik adaptive filter
    e2     = CompoundValue(len, (ma2 - jrkout[1]) * Power(1 - alpha, 2) + Power(alpha, 2) * e2[1], 0);
    jrkout = CompoundValue(len, e2 + jrkout[1], src);
    plot return = jrkout;
}
def maOpen;
def maClose;
def maLow;
def maHigh;

if jurik {
    maOpen  = jurik_filt(open, JuirkLength, jphs);
    maClose = jurik_filt(close,JuirkLength, jphs);
    maLow   = jurik_filt(low , JuirkLength, jphs);
    maHigh  = jurik_filt(high, JuirkLength, jphs);

} else {
    maOpen  = SimpleMovingAvg(open, Period);
    maClose = SimpleMovingAvg(close, Period);
    maHigh  = SimpleMovingAvg(high, Period);
    maLow   = SimpleMovingAvg(low, Period);
}
def haClose;

if better {
    if (maHigh != maLow) {
        haClose = (maOpen + maClose) / 2 + (((maClose - maOpen) / (maHigh - maLow)) * AbsValue((maClose - maOpen) / 2));
    } else {
        haClose = (maOpen + maClose) / 2;
    }
} else {
    haClose = (maOpen + maHigh + maLow + maClose) / 4;
}

def haOpen;
def haHigh;
def haLow;
haOpen = CompoundValue(1, (haopen[1] + haclose[1]) / 2, (maOpen[1] + maClose[1]) / 2);
haHigh = Max(maHigh, Max(haOpen, haClose));
haLow  = Min(maOpen, Min(haOpen, haClose));

def raising = (haOpen < haClose);

def outLow   = haLow;
def outHigh  = haHigh;
def outOpen  = CompoundValue(1, haOpen, na);
def outClose = haClose;

plot l = if !StyleH then na else outLow;
l.AssignValueColor(if raising then Color.CYAN else Color.MaGENTA);
plot h = if !StyleH then na else outHigh;
h.AssignValueColor(if raising then Color.CYAN else Color.MaGENTA);
#--- Par Calc

def percentHL = ((outOpen - outClose) / ((outOpen + outClose)/2)) * 100;

def high_squeeze= AbsValue(percentHL) < ParabolicPercent and percentHL>0;
def low_squeeze = AbsValue(percentHL) < ParabolicPercent and percentHL<0;

def crossPlot = (outHigh + outLow) / 2;
def state;
if raising {
    state     = 1;
    } else { 
    state     = -1;}

def plotColor =  if high_squeeze then 1 else
                 if low_squeeze then -1 else
                 if raising then 2 else -2;

plot haPoints = if(!Style or plotColor==1 or plotColor==-1, na, crossPlot);
#haPoints.SetLineWeight(2);
haPoints.SetPaintingStrategy(PaintingStrategy.LINE_VS_POINTS);
haPoints.AssignValueColor(if plotColor== 2 then Color.GREEN else Color.RED);

plot haLine = if(!Style, na, crossPlot);
#haLine.SetLineWeight(2);
#haLine.SetStyle(Curve.POINTS);
haLine.AssignValueColor(if raising then  color.UPTICK else Color.DOWNTICK);

def trBull = if state== 1 then trBull[1]+1 else 0;
def trBear = if state==-1 then trBear[1]+1 else 0;

def transitionBarBull = if trBull==1 then crossPlot else transitionBarBull[1];
def transitionBarBear = if trBear==1 then crossPlot else transitionBarBear[1];

def transitionPriceBull = if trBull  then transitionBarBull[1] else transitionPriceBull[1];
def transitionPriceBear = if trBear  then transitionBarBear[1] else transitionPriceBear[1];

def hlineBull = CompoundValue(1,if isNaN(close) or transitionPriceBull==0 then na else transitionPriceBull, na);
def hlineBear = CompoundValue(1,if isNaN(close) or transitionPriceBear==0 then na else transitionPriceBear, na);

plot horizLineBull = if !transitionLine then na else hlineBull;
horizLineBull.SetDefaultColor(Color.RED);
horizLineBull.SetPaintingStrategy(PaintingStrategy.HORIZONTAL);

plot horizLineBear = if !transitionLine then na else hlineBear;
horizLineBear.SetDefaultColor(Color.GREEN);
horizLineBear.SetPaintingStrategy(PaintingStrategy.HORIZONTAL);

#----Plot Candles
AddChart(high = if showcandles and raising then outHigh else na, low = outLow, open = outClose, close = outOpen,
         type = ChartType.CANDLE, growcolor =  CreateColor(0,153,153));
AddChart(high = if showcandles and !raising then outHigh else na, low = outLow , open = outOpen,  close = outClose,
         type = ChartType.CANDLE, growcolor =  CreateColor(153,0,153));

#--- Clouds
AddCloud(if !showfill then na else if raising then outhigh else outLow, if raising then outLow else outhigh, color.DARK_GREEN, Color.PLUM);

#---Bar Color
AssignPriceColor(if !colorbars then Color.CURRENT else
                    if raising and close > crossPlot then Color.GREEN else
                    if raising then Color.DARK_GREEN else
                    if !raising and close < crossPlot then Color.RED else Color.DARK_RED);

#--- END CODE
 

Attachments

  • vDdJdKz.png
    vDdJdKz.png
    611.3 KB · Views: 238

Similar threads

Not the exact question you're looking for?

Start a new thread and receive assistance from our community.

87k+ Posts
574 Online
Create Post

Similar threads

Similar threads

The Market Trading Game Changer

Join 2,500+ subscribers inside the useThinkScript VIP Membership Club
  • Exclusive indicators
  • Proven strategies & setups
  • Private Discord community
  • ‘Buy The Dip’ signal alerts
  • Exclusive members-only content
  • Add-ons and resources
  • 1 full year of unlimited support

Frequently Asked Questions

What is useThinkScript?

useThinkScript is the #1 community of stock market investors using indicators and other tools to power their trading strategies. Traders of all skill levels use our forums to learn about scripting and indicators, help each other, and discover new ways to gain an edge in the markets.

How do I get started?

We get it. Our forum can be intimidating, if not overwhelming. With thousands of topics, tens of thousands of posts, our community has created an incredibly deep knowledge base for stock traders. No one can ever exhaust every resource provided on our site.

If you are new, or just looking for guidance, here are some helpful links to get you started.

What are the benefits of VIP Membership?
VIP members get exclusive access to these proven and tested premium indicators: Buy the Dip, Advanced Market Moves 2.0, Take Profit, and Volatility Trading Range. In addition, VIP members get access to over 50 VIP-only custom indicators, add-ons, and strategies, private VIP-only forums, private Discord channel to discuss trades and strategies in real-time, customer support, trade alerts, and much more. Learn all about VIP membership here.
How can I access the premium indicators?
To access the premium indicators, which are plug and play ready, sign up for VIP membership here.
Back
Top