STD-Filtered, N-Pole Gaussian Filter [Loxx] For ThinkOrSwim

jmcjkl

New member
Author states:
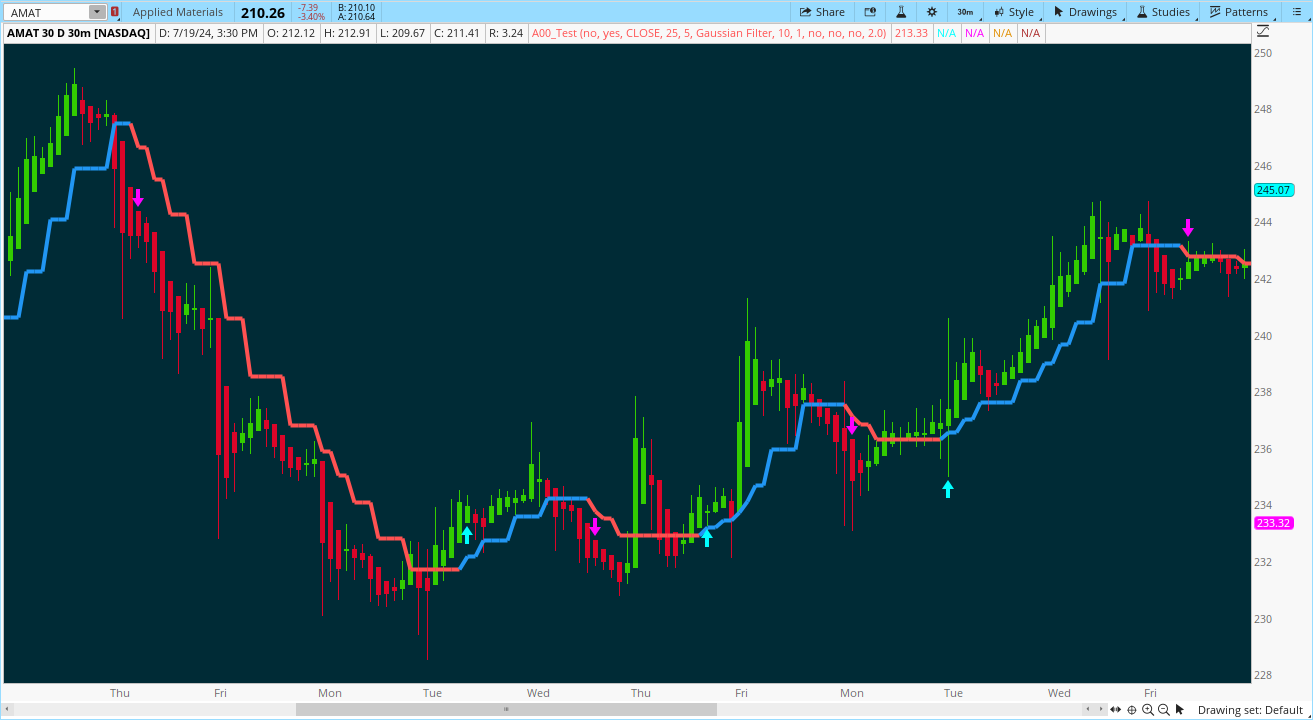
This is a Gaussian Filter with Standard Deviation Filtering that works for orders (poles) higher than the usual 4 poles that was originally available in Ehlers Gaussian Filter formulas. Because of that, it is a sort of generalized Gaussian filter that can calculate arbitrary (order) pole Gaussian Filter and which makes it a sort of a unique indicator. For this implementation, the practical mathematical maximum is 9poles after which the precision of calculation is useless--the coefficients for levels above 9 poles are so high that the precision loss actually means very little. Despite this maximal precision utility, I've left the upper bound of poles open-ended so you can try poles of order 9 and above yourself. The default is set to 5 poles which is 1 pole greater than the normal maximum of 4 poles.

The purpose of the standard deviation filter is to filter out noise by and by default it will filter 1 standard deviation. Adjust this number and the filter selections (price, both, GMA, none) to reduce the signal noise.
JSiSXkp.png

What is Ehlers Gaussian filter?
This filter can be used for smoothing. It rejects high frequencies (fast movements) better than an EMA and has lower lag. published by John F. Ehlers in "Rocket Science For Traders".

A Gaussian filter is one whose transfer response is described by the familiar Gaussian bell-shaped curve. In the case of low-pass filters, only the upper half of the curve describes the filter. The use of gaussian filters is a move toward achieving the dual goal of reducing lag and reducing the lag of high-frequency components relative to the lag of lower-frequency components.

A gaussian filter with...
  • One Pole: f = alpha*g + (1-alpha)f
  • Two Poles: f = alpha*2g + 2(1-alpha)f - (1-alpha)2f
  • Three Poles: f = alpha*3g + 3(1-alpha)f - 3(1-alpha)2f + (1-alpha)3f
  • Four Poles: f = alpha*4g + 4(1-alpha)f - 6(1-alpha)2f + 4(1-alpha)3f - (1-alpha)4f
  • and so on...

For an equivalent number of poles the lag of a Gaussian is about half the lag of a Butterworth filters: Lag = N*P / pi^2, where,
N is the number of poles, and
P is the critical period

Special initialization of filter stages ensures proper working in scans with as few bars as possible.

From Ehlers Book: "The first objective of using smoothers is to eliminate or reduce the undesired high-frequency components in the eprice data. Therefore these smoothers are called low-pass filters, and they all work by some form of averaging. Butterworth low-pass filters can do this job, but nothing comes for free. A higher degree of filtering is necessarily accompanied by a larger amount of lag. We have come to see that is a fact of life."

Original Tradingview script:
https://www.tradingview.com/script/i4xZNAoy-STD-Filtered-N-Pole-Gaussian-Filter-Loxx/
ThinkOrSwim script is below
 
Last edited by a moderator:

Join useThinkScript to post your question to a community of 21,000+ developers and traders.

@samer800
Sam, Can you convert a loxx file from Tradingview?

https://www.tradingview.com/script/i4xZNAoy-STD-Filtered-N-Pole-Gaussian-Filter-Loxx/
Ruby:
// This source code is subject to the terms of the Mozilla Public License 2.0 at https://mozilla.org/MPL/2.0/
// © loxx
//@version=5
indicator("STD-Filtered, N-Pole Gaussian Filter [Loxx]",
     shorttitle="STDFNPGF [Loxx]",
     overlay = true)
    
import loxx/loxxexpandedsourcetypes/4
greencolor = #2DD204 
redcolor = #D2042D
//factorial calc
fact(int n)=>
    float a = 1
    for i = 1 to n
        a *= i
    a
//alpha calc
_alpha(int period, int poles)=>
    w = 2.0 * math.pi / period
    float b = (1.0 - math.cos(w)) / (math.pow(1.414, 2.0 / poles) - 1.0)
    float a = - b + math.sqrt(b * b + 2.0 * b)
    a
   
//n-pole calc
_makeCoeffs(simple int period, simple int order)=>
    coeffs = matrix.new<float>(order + 1, 3, 0.)
    float a = _alpha(period, order)
    for r = 0 to order
        out = nz(fact(order) / (fact(order - r) * fact(r)), 1)
        matrix.set(coeffs, r, 0, out)
        matrix.set(coeffs, r, 1, math.pow(a, r))
        matrix.set(coeffs, r, 2, math.pow(1.0 - a, r))
    coeffs
   
//n-pole calc
_npolegf(float src, simple int period, simple int order)=>
    var coeffs = _makeCoeffs(period, order)
    float filt = src * matrix.get(coeffs, order, 1)
    int sign = 1
    for r = 1 to order
        filt += sign * matrix.get(coeffs, r, 0) * matrix.get(coeffs, r, 2) * nz(filt[r])
        sign *= -1
    filt
//std filter
_filt(float src, int len, float filter)=>
    float price = src
    float filtdev = filter * ta.stdev(src, len)
    price := math.abs(price - nz(price[1])) < filtdev ? nz(price[1]) : price
    price
   
smthtype = input.string("Kaufman", "Heiken-Ashi Better Smoothing", options = ["AMA", "T3", "Kaufman"], group=  "Source Settings")
srcoption = input.string("Close", "Source", group= "Source Settings",
     options =
     ["Close", "Open", "High", "Low", "Median", "Typical", "Weighted", "Average", "Average Median Body", "Trend Biased", "Trend Biased (Extreme)",
     "HA Close", "HA Open", "HA High", "HA Low", "HA Median", "HA Typical", "HA Weighted", "HA Average", "HA Average Median Body", "HA Trend Biased", "HA Trend Biased (Extreme)",
     "HAB Close", "HAB Open", "HAB High", "HAB Low", "HAB Median", "HAB Typical", "HAB Weighted", "HAB Average", "HAB Average Median Body", "HAB Trend Biased", "HAB Trend Biased (Extreme)"])
period = input.int(25,'Period', group = "Basic Settings")
order = input.int(5,'Order', group = "Basic Settings", minval = 1)
filterop = input.string("Gaussian Filter", "Filter Options", options = ["Price", "Gaussian Filter", "Both", "None"], group=  "Filter Settings")
filter = input.float(1, "Filter Devaitions", minval = 0, group= "Filter Settings")
filterperiod = input.int(10, "Filter Period", minval = 0, group= "Filter Settings")
colorbars = input.bool(true, "Color bars?", group = "UI Options")
showSigs = input.bool(true, "Show signals?", group= "UI Options")
kfl=input.float(0.666, title="* Kaufman's Adaptive MA (KAMA) Only - Fast End", group = "Moving Average Inputs")
ksl=input.float(0.0645, title="* Kaufman's Adaptive MA (KAMA) Only - Slow End", group = "Moving Average Inputs")
amafl = input.int(2, title="* Adaptive Moving Average (AMA) Only - Fast", group = "Moving Average Inputs")
amasl = input.int(30, title="* Adaptive Moving Average (AMA) Only - Slow", group = "Moving Average Inputs")
[haclose, haopen, hahigh, halow, hamedian, hatypical, haweighted, haaverage] = request.security(ticker.heikinashi(syminfo.tickerid), timeframe.period, [close, open, high, low, hl2, hlc3, hlcc4, ohlc4])
float src = switch srcoption
    "Close" => loxxexpandedsourcetypes.rclose()
    "Open" => loxxexpandedsourcetypes.ropen()
    "High" => loxxexpandedsourcetypes.rhigh()
    "Low" => loxxexpandedsourcetypes.rlow()
    "Median" => loxxexpandedsourcetypes.rmedian()
    "Typical" => loxxexpandedsourcetypes.rtypical()
    "Weighted" => loxxexpandedsourcetypes.rweighted()
    "Average" => loxxexpandedsourcetypes.raverage()
    "Average Median Body" => loxxexpandedsourcetypes.ravemedbody()
    "Trend Biased" => loxxexpandedsourcetypes.rtrendb()
    "Trend Biased (Extreme)" => loxxexpandedsourcetypes.rtrendbext()
    "HA Close" => loxxexpandedsourcetypes.haclose(haclose)
    "HA Open" => loxxexpandedsourcetypes.haopen(haopen)
    "HA High" => loxxexpandedsourcetypes.hahigh(hahigh)
    "HA Low" => loxxexpandedsourcetypes.halow(halow)
    "HA Median" => loxxexpandedsourcetypes.hamedian(hamedian)
    "HA Typical" => loxxexpandedsourcetypes.hatypical(hatypical)
    "HA Weighted" => loxxexpandedsourcetypes.haweighted(haweighted)
    "HA Average" => loxxexpandedsourcetypes.haaverage(haaverage)
    "HA Average Median Body" => loxxexpandedsourcetypes.haavemedbody(haclose, haopen)
    "HA Trend Biased" => loxxexpandedsourcetypes.hatrendb(haclose, haopen, hahigh, halow)
    "HA Trend Biased (Extreme)" => loxxexpandedsourcetypes.hatrendbext(haclose, haopen, hahigh, halow)
    "HAB Close" => loxxexpandedsourcetypes.habclose(smthtype, amafl, amasl, kfl, ksl)
    "HAB Open" => loxxexpandedsourcetypes.habopen(smthtype, amafl, amasl, kfl, ksl)
    "HAB High" => loxxexpandedsourcetypes.habhigh(smthtype, amafl, amasl, kfl, ksl)
    "HAB Low" => loxxexpandedsourcetypes.hablow(smthtype, amafl, amasl, kfl, ksl)
    "HAB Median" => loxxexpandedsourcetypes.habmedian(smthtype, amafl, amasl, kfl, ksl)
    "HAB Typical" => loxxexpandedsourcetypes.habtypical(smthtype, amafl, amasl, kfl, ksl)
    "HAB Weighted" => loxxexpandedsourcetypes.habweighted(smthtype, amafl, amasl, kfl, ksl)
    "HAB Average" => loxxexpandedsourcetypes.habaverage(smthtype, amafl, amasl, kfl, ksl)
    "HAB Average Median Body" => loxxexpandedsourcetypes.habavemedbody(smthtype, amafl, amasl, kfl, ksl)
    "HAB Trend Biased" => loxxexpandedsourcetypes.habtrendb(smthtype, amafl, amasl, kfl, ksl)
    "HAB Trend Biased (Extreme)" => loxxexpandedsourcetypes.habtrendbext(smthtype, amafl, amasl, kfl, ksl)
    => haclose
src := filterop == "Both" or filterop == "Price" and filter > 0 ? _filt(src, filterperiod, filter) : src
out = _npolegf(src, period, order)
out := filterop == "Both" or filterop == "Gaussian Filter" and filter > 0 ? _filt(out, filterperiod, filter) : out
sig = nz(out[1])
state = 0
if (out > sig)
    state := 1
if (out < sig)
    state := -1
pregoLong = out > sig and (nz(out[1]) < nz(sig[1]) or nz(out[1]) == nz(sig[1]))
pregoShort = out < sig and (nz(out[1]) > nz(sig[1]) or nz(out[1]) == nz(sig[1]))
contsw = 0
contsw := nz(contsw[1])
contsw := pregoLong ? 1 : pregoShort ? -1 : nz(contsw[1])
goLong = pregoLong and nz(contsw[1]) == -1
goShort = pregoShort and nz(contsw[1]) == 1
var color colorout = na
colorout := state == -1 ? redcolor : state == 1 ? greencolor : nz(colorout[1])
plot(out, "N-Pole GF", color = colorout, linewidth = 3)
barcolor(colorbars ? colorout : na)
plotshape(showSigs and goLong, title = "Long", color = color.yellow, textcolor = color.yellow, text = "L", style = shape.triangleup, location = location.belowbar, size = size.tiny)
plotshape(showSigs and goShort, title = "Short", color = color.fuchsia, textcolor = color.fuchsia, text = "S", style = shape.triangledown, location = location.abovebar, size = size.tiny)
alertcondition(goLong, title = "Long", message = "STD-Filtered, N-Pole Gaussian Filter [Loxx]: Long\nSymbol: {{ticker}}\nPrice: {{close}}")
alertcondition(goShort, title = "Short", message = "STD-Filtered, N-Pole Gaussian Filter [Loxx]: Short\nSymbol: {{ticker}}\nPrice: {{close}}")

Can somebody convert with thinkscript?
check below. I added multiple options as well. - Limited to 9 poles max -

CSS:
#// Indicator for TOS
#// © loxx
# compined with indicator "Gaussian Channel [DW]" by @DonovanWall
#indicator("STD-Filtered, N-Pole Gaussian Filter [Loxx]", shorttitle="STDFNPGF [Loxx]"
# Converted and mod by Sam4Cok@Samer800    - 07/2024
input colorBars = no;     # "Color bars?"
input showSignals = yes;  # "Show signals?"
input source = close;
input period = 25;         # "Period"
input noOfPoles = 5;       # "Order"
input FilterOptions = {"Price", default "Gaussian Filter", "Both", "None"}; # "Filter Options"
input filterPeriod = 10;     # "Filter Period"
input FilterDevaitions = 1;  # "Filter Devaitions"
input ReducedLagMode  = no;  # "Reduced Lag Mode"
input FastResponseMode = no; # "Fast Response Mode"
input showBand = no;
input bandMultiplier = 2.0;


def na = Double.NaN;
def pi = Double.Pi;
def order = Min(Max(noOfPoles, 1), 9);
def price = FilterOptions==FilterOptions."Price" or FilterOptions==FilterOptions."Both";
def gauss = FilterOptions==FilterOptions."Gaussian Filter" or FilterOptions==FilterOptions."Both";

#-- color
DefineGlobalColor("up", CreateColor(33,150,243));
DefineGlobalColor("dup",CreateColor(6, 66, 113));
DefineGlobalColor("dn", CreateColor(255, 82, 82));

#-- func
Script nz {
input source = close;
input replace = 0;
    def nz = if isNaN(source) then 0 else source;
    plot out = if isNaN(close) then Double.NaN else if nz then nz else replace;
}
#//std filter
Script _filt {
input src = close;
input len = 10;
input filter = 1;
    def filtdev = filter * stdev(src, len);
    def filt = if !filt[1] then src else
               if AbsValue(src - nz(filt[1],src)) < filtdev then nz(filt[1], src) else src;
    plot out = if isNaN(close) then Double.NaN else CompoundValue(1, filt, src);
}
#//Filter function
#f_filt9x (_a, _s, _i) =>
script f_filt9x {
    input _a = 1;
    input _s = close;
    input _i = 1;
    def _x = (1 - _a);
    def filt = _s * power(_a, _i);
    def _m2 = if _i == 9 then 36  else if _i == 8 then 28 else if _i == 7 then 21 else
              if _i == 6 then 15  else if _i == 5 then 10 else if _i == 4 then 6  else
              if _i == 3 then 3   else if _i == 2 then 1  else 0;
    def _m3 = if _i == 9 then 84  else if _i == 8 then 56 else if _i == 7 then 35 else
              if _i == 6 then 20  else if _i == 5 then 10 else if _i == 4 then 4  else
              if _i == 3 then 1   else 0;
    def _m4 = if _i == 9 then 126 else if _i == 8 then 70 else if _i == 7 then 35 else
              if _i == 6 then 15  else if _i == 5 then 5  else if _i == 4 then 1  else 0;
    def _m5 = if _i == 9 then 126 else if _i == 8 then 56 else if _i == 7 then 21 else
              if _i == 6 then 6   else if _i == 5 then 1  else 0;
    def _m6 = if _i == 9 then 84  else if _i == 8 then 28 else if _i == 7 then 7  else
              if _i == 6 then 1   else 0;
    def _m7 = if _i == 9 then 36  else if _i == 8 then 8  else if _i == 7 then 1  else 0;
    def _m8 = if _i == 9 then 9   else if _i == 8 then 1  else 0;
    def _m9 = if _i == 9 then 1   else 0;
#    // filter
    def _f = filt + _i * _x * (_f[1]) -
            (if _i >= 2 then _m2 * Power(_x, 2) * nz(_f[2]) else 0) +
            (if _i >= 3 then _m3 * Power(_x, 3) * nz(_f[3]) else 0) -
            (if _i >= 4 then _m4 * Power(_x, 4) * nz(_f[4]) else 0) +
            (if _i >= 5 then _m5 * Power(_x, 5) * nz(_f[5]) else 0) -
            (if _i >= 6 then _m6 * Power(_x, 6) * nz(_f[6]) else 0) +
            (if _i >= 7 then _m7 * Power(_x, 7) * nz(_f[7]) else 0) -
            (if _i >= 8 then _m8 * Power(_x, 8) * nz(_f[8]) else 0) +
            (if _i == 9 then _m9 * Power(_x, 9) * nz(_f[9]) else 0);
    plot return = if isNaN(close) then Double.NaN else if isNaN(_f) then 0 else _f;
}
#//9 var declaration fun
#f_pole (_a, _s, _i) =>
script f_pole {
    input _a = 1;
    input _s = close;
    input _i = 5;
    def coff2 = f_filt9x(_a, _s, 2);
    def coff3 = f_filt9x(_a, _s, 3);
    def coff4 = f_filt9x(_a, _s, 4);
    def coff5 = f_filt9x(_a, _s, 5);
    def coff6 = f_filt9x(_a, _s, 6);
    def coff7 = f_filt9x(_a, _s, 7);
    def coff8 = f_filt9x(_a, _s, 8);
    def coff9 = f_filt9x(_a, _s, 9);
    def _f1 = f_filt9x(_a, _s, 1);
    def _f2 = (if _i >= 2 then coff2 else 0);
    def _f3 = (if _i >= 3 then coff3 else 0);
    def _f4 = (if _i >= 4 then coff4 else 0);
    def _f5 = (if _i >= 5 then coff5 else 0);
    def _f6 = (if _i >= 6 then coff6 else 0);
    def _f7 = (if _i >= 2 then coff7 else 0);
    def _f8 = (if _i >= 8 then coff8 else 0);
    def _f9 = (if _i == 9 then coff9 else 0);
    def _fn = if _i == 1 then _f1 else if _i == 2 then _f2 else if _i == 3 then _f3 else
              if _i == 4 then _f4 else if _i == 5 then _f5 else if _i == 6 then _f6 else
              if _i == 7 then _f7 else if _i == 8 then _f8 else if _i == 9 then _f9 else Double.NaN;
    plot filtn =  if isNaN(close) then Double.NaN else _fn;
#    plot filt1 = _f1;
}
def w = 2.0 * Pi / period;
def beta = (1.0 - Cos(w)) / (Power(1.414, 2.0 / order) - 1.0);
def alpha = - beta + Sqrt(Power(beta, 2) + 2 * beta);
#//Lag
def lag = (Period - 1) / (2 * order);
def tr = TrueRange(high, close, low);
#//Data
def srcData = if ReducedLagMode then 2 * source - source[lag] else source;
def trdata  = if ReducedLagMode then 2 * tr - tr[lag] else tr;

def filtSrc = _filt(srcData, filterperiod, FilterDevaitions);
def src = if price and FilterDevaitions > 0 then filtSrc else srcData;

def filtn = f_pole(alpha, src, order);
def filt1 = f_filt9x(alpha, src, 1);
def filtntr = f_pole(alpha, trdata,  order);
def filt1tr = f_filt9x(alpha, trdata, 1);

def filt   = if FastResponseMode then (filtn + filt1) / 2 else filtn;
def filttr = if FastResponseMode then (filtntr + filt1tr) / 2 else filtntr;

def filtStd = _filt(filt, filterperiod, FilterDevaitions);
def filtBand = _filt(filttr, filterperiod, FilterDevaitions);

def std = if gauss and FilterDevaitions > 0 then filtStd else filt;
def fTR = if gauss and FilterDevaitions > 0 then filtBand else filttr;
#//Bands
def hband = std + fTR * bandMultiplier;
def lband = std - fTR * bandMultiplier;

def sig = nz(std[1]);

def state = if (std > sig) then  1 else
            if (std < sig) then -1 else 0;
def pregoLong  = std > sig and (sig < nz(sig[1]) or sig == nz(sig[1]));
def pregoShort = std < sig and (sig > nz(sig[1]) or sig == nz(sig[1]));

def contsw = if pregoLong then 1 else if pregoShort then -1 else nz(contsw[1]);

def goLong = pregoLong and nz(contsw[1]) == -1;
def goShort = pregoShort and nz(contsw[1]) == 1;

def col = if state == -1 then -1 else
          if state ==  1 then 1 else nz(col[1]);
def cloudCol = col;

plot nPoleGf = if std then std else na;
nPoleGf.SetLineWeight(2);
nPoleGf.AssignValueColor(if cloudCol>0 then GlobalColor("up") else
                         if cloudCol<0 then GlobalColor("dn") else Color.GRAY);
plot sigUp = if showSignals and goLong then low else na;
plot sigDn = if showSignals and goShort then high else na;
sigUp.SetDefaultColor(Color.CYAN);
sigDn.SetDefaultColor(Color.MAGENTA);
sigUp.SetPaintingStrategy(PaintingStrategy.BOOLEAN_ARROW_UP);
sigDn.SetPaintingStrategy(PaintingStrategy.BOOLEAN_ARROW_DOWN);

#//Band Plots

plot bandHi = if showBand then hband else na;
plot bandLo = if showBand then lband else na;
bandHi.AssignValueColor(if cloudCol>0 then GlobalColor("up") else
                        if cloudCol<0 then GlobalColor("dn") else Color.GRAY);
bandLo.AssignValueColor(if cloudCol>0 then GlobalColor("up") else
                        if cloudCol<0 then GlobalColor("dn") else Color.GRAY);

AddCloud(if cloudCol>0 or cloudCol[-1] > 0 then bandHi else na, bandLo, GlobalColor("dup"));
AddCloud(if cloudCol<0 or cloudCol[-1] < 0 then bandHi else na, bandLo, Color.DARK_RED);

#-- bar color

AssignPriceColor(if !colorBars then Color.CURRENT else
                 if cloudCol>0 then Color.GREEN else
                 if cloudCol<0 then Color.RED else Color.GRAY);


#-- END of CODE
 
This is another excellent conversion by the amazing @samer800.

Please note:
No Scans, No Watchlists, No Conditional Orders. Schwab limits the amount of resources available for scans, watchlists, and conditional orders. This script's requirements exceeds the maximum resources available.
Meaning, this study is too complicated for use in any of the ToS widgets. It can only be used to plot on the chart.

Also, the script functions used in these study do not lend themselves to use in MTF studies.

@wardog @camerdr
 
Last edited:
check below. I added multiple options as well. - Limited to 9 poles max -

CSS:
#// Indicator for TOS
#// © loxx
# compined with indicator "Gaussian Channel [DW]" by @DonovanWall
#indicator("STD-Filtered, N-Pole Gaussian Filter [Loxx]", shorttitle="STDFNPGF [Loxx]"
# Converted and mod by Sam4Cok@Samer800    - 07/2024
input colorBars = no;     # "Color bars?"
input showSignals = yes;  # "Show signals?"
input source = close;
input period = 25;         # "Period"
input noOfPoles = 5;       # "Order"
input FilterOptions = {"Price", default "Gaussian Filter", "Both", "None"}; # "Filter Options"
input filterPeriod = 10;     # "Filter Period"
input FilterDevaitions = 1;  # "Filter Devaitions"
input ReducedLagMode  = no;  # "Reduced Lag Mode"
input FastResponseMode = no; # "Fast Response Mode"
input showBand = no;
input bandMultiplier = 2.0;


def na = Double.NaN;
def pi = Double.Pi;
def order = Min(Max(noOfPoles, 1), 9);
def price = FilterOptions==FilterOptions."Price" or FilterOptions==FilterOptions."Both";
def gauss = FilterOptions==FilterOptions."Gaussian Filter" or FilterOptions==FilterOptions."Both";

#-- color
DefineGlobalColor("up", CreateColor(33,150,243));
DefineGlobalColor("dup",CreateColor(6, 66, 113));
DefineGlobalColor("dn", CreateColor(255, 82, 82));

#-- func
Script nz {
input source = close;
input replace = 0;
    def nz = if isNaN(source) then 0 else source;
    plot out = if isNaN(close) then Double.NaN else if nz then nz else replace;
}
#//std filter
Script _filt {
input src = close;
input len = 10;
input filter = 1;
    def filtdev = filter * stdev(src, len);
    def filt = if !filt[1] then src else
               if AbsValue(src - nz(filt[1],src)) < filtdev then nz(filt[1], src) else src;
    plot out = if isNaN(close) then Double.NaN else CompoundValue(1, filt, src);
}
#//Filter function
#f_filt9x (_a, _s, _i) =>
script f_filt9x {
    input _a = 1;
    input _s = close;
    input _i = 1;
    def _x = (1 - _a);
    def filt = _s * power(_a, _i);
    def _m2 = if _i == 9 then 36  else if _i == 8 then 28 else if _i == 7 then 21 else
              if _i == 6 then 15  else if _i == 5 then 10 else if _i == 4 then 6  else
              if _i == 3 then 3   else if _i == 2 then 1  else 0;
    def _m3 = if _i == 9 then 84  else if _i == 8 then 56 else if _i == 7 then 35 else
              if _i == 6 then 20  else if _i == 5 then 10 else if _i == 4 then 4  else
              if _i == 3 then 1   else 0;
    def _m4 = if _i == 9 then 126 else if _i == 8 then 70 else if _i == 7 then 35 else
              if _i == 6 then 15  else if _i == 5 then 5  else if _i == 4 then 1  else 0;
    def _m5 = if _i == 9 then 126 else if _i == 8 then 56 else if _i == 7 then 21 else
              if _i == 6 then 6   else if _i == 5 then 1  else 0;
    def _m6 = if _i == 9 then 84  else if _i == 8 then 28 else if _i == 7 then 7  else
              if _i == 6 then 1   else 0;
    def _m7 = if _i == 9 then 36  else if _i == 8 then 8  else if _i == 7 then 1  else 0;
    def _m8 = if _i == 9 then 9   else if _i == 8 then 1  else 0;
    def _m9 = if _i == 9 then 1   else 0;
#    // filter
    def _f = filt + _i * _x * (_f[1]) -
            (if _i >= 2 then _m2 * Power(_x, 2) * nz(_f[2]) else 0) +
            (if _i >= 3 then _m3 * Power(_x, 3) * nz(_f[3]) else 0) -
            (if _i >= 4 then _m4 * Power(_x, 4) * nz(_f[4]) else 0) +
            (if _i >= 5 then _m5 * Power(_x, 5) * nz(_f[5]) else 0) -
            (if _i >= 6 then _m6 * Power(_x, 6) * nz(_f[6]) else 0) +
            (if _i >= 7 then _m7 * Power(_x, 7) * nz(_f[7]) else 0) -
            (if _i >= 8 then _m8 * Power(_x, 8) * nz(_f[8]) else 0) +
            (if _i == 9 then _m9 * Power(_x, 9) * nz(_f[9]) else 0);
    plot return = if isNaN(close) then Double.NaN else if isNaN(_f) then 0 else _f;
}
#//9 var declaration fun
#f_pole (_a, _s, _i) =>
script f_pole {
    input _a = 1;
    input _s = close;
    input _i = 5;
    def coff2 = f_filt9x(_a, _s, 2);
    def coff3 = f_filt9x(_a, _s, 3);
    def coff4 = f_filt9x(_a, _s, 4);
    def coff5 = f_filt9x(_a, _s, 5);
    def coff6 = f_filt9x(_a, _s, 6);
    def coff7 = f_filt9x(_a, _s, 7);
    def coff8 = f_filt9x(_a, _s, 8);
    def coff9 = f_filt9x(_a, _s, 9);
    def _f1 = f_filt9x(_a, _s, 1);
    def _f2 = (if _i >= 2 then coff2 else 0);
    def _f3 = (if _i >= 3 then coff3 else 0);
    def _f4 = (if _i >= 4 then coff4 else 0);
    def _f5 = (if _i >= 5 then coff5 else 0);
    def _f6 = (if _i >= 6 then coff6 else 0);
    def _f7 = (if _i >= 2 then coff7 else 0);
    def _f8 = (if _i >= 8 then coff8 else 0);
    def _f9 = (if _i == 9 then coff9 else 0);
    def _fn = if _i == 1 then _f1 else if _i == 2 then _f2 else if _i == 3 then _f3 else
              if _i == 4 then _f4 else if _i == 5 then _f5 else if _i == 6 then _f6 else
              if _i == 7 then _f7 else if _i == 8 then _f8 else if _i == 9 then _f9 else Double.NaN;
    plot filtn =  if isNaN(close) then Double.NaN else _fn;
#    plot filt1 = _f1;
}
def w = 2.0 * Pi / period;
def beta = (1.0 - Cos(w)) / (Power(1.414, 2.0 / order) - 1.0);
def alpha = - beta + Sqrt(Power(beta, 2) + 2 * beta);
#//Lag
def lag = (Period - 1) / (2 * order);
def tr = TrueRange(high, close, low);
#//Data
def srcData = if ReducedLagMode then 2 * source - source[lag] else source;
def trdata  = if ReducedLagMode then 2 * tr - tr[lag] else tr;

def filtSrc = _filt(srcData, filterperiod, FilterDevaitions);
def src = if price and FilterDevaitions > 0 then filtSrc else srcData;

def filtn = f_pole(alpha, src, order);
def filt1 = f_filt9x(alpha, src, 1);
def filtntr = f_pole(alpha, trdata,  order);
def filt1tr = f_filt9x(alpha, trdata, 1);

def filt   = if FastResponseMode then (filtn + filt1) / 2 else filtn;
def filttr = if FastResponseMode then (filtntr + filt1tr) / 2 else filtntr;

def filtStd = _filt(filt, filterperiod, FilterDevaitions);
def filtBand = _filt(filttr, filterperiod, FilterDevaitions);

def std = if gauss and FilterDevaitions > 0 then filtStd else filt;
def fTR = if gauss and FilterDevaitions > 0 then filtBand else filttr;
#//Bands
def hband = std + fTR * bandMultiplier;
def lband = std - fTR * bandMultiplier;

def sig = nz(std[1]);

def state = if (std > sig) then  1 else
            if (std < sig) then -1 else 0;
def pregoLong  = std > sig and (sig < nz(sig[1]) or sig == nz(sig[1]));
def pregoShort = std < sig and (sig > nz(sig[1]) or sig == nz(sig[1]));

def contsw = if pregoLong then 1 else if pregoShort then -1 else nz(contsw[1]);

def goLong = pregoLong and nz(contsw[1]) == -1;
def goShort = pregoShort and nz(contsw[1]) == 1;

def col = if state == -1 then -1 else
          if state ==  1 then 1 else nz(col[1]);
def cloudCol = col;

plot nPoleGf = if std then std else na;
nPoleGf.SetLineWeight(2);
nPoleGf.AssignValueColor(if cloudCol>0 then GlobalColor("up") else
                         if cloudCol<0 then GlobalColor("dn") else Color.GRAY);
plot sigUp = if showSignals and goLong then low else na;
plot sigDn = if showSignals and goShort then high else na;
sigUp.SetDefaultColor(Color.CYAN);
sigDn.SetDefaultColor(Color.MAGENTA);
sigUp.SetPaintingStrategy(PaintingStrategy.BOOLEAN_ARROW_UP);
sigDn.SetPaintingStrategy(PaintingStrategy.BOOLEAN_ARROW_DOWN);

#//Band Plots

plot bandHi = if showBand then hband else na;
plot bandLo = if showBand then lband else na;
bandHi.AssignValueColor(if cloudCol>0 then GlobalColor("up") else
                        if cloudCol<0 then GlobalColor("dn") else Color.GRAY);
bandLo.AssignValueColor(if cloudCol>0 then GlobalColor("up") else
                        if cloudCol<0 then GlobalColor("dn") else Color.GRAY);

AddCloud(if cloudCol>0 or cloudCol[-1] > 0 then bandHi else na, bandLo, GlobalColor("dup"));
AddCloud(if cloudCol<0 or cloudCol[-1] < 0 then bandHi else na, bandLo, Color.DARK_RED);

#-- bar color

AssignPriceColor(if !colorBars then Color.CURRENT else
                 if cloudCol>0 then Color.GREEN else
                 if cloudCol<0 then Color.RED else Color.GRAY);


#-- END of CODE
Sam, Thank you very much. I appreciate the time and effort you took to convert this. Have a great day.
 
This study is IMHO one of the best that I have seen in my many years of trading.

For my 5 minute SPX chart, I have the period set to 15 and the noOfPoles set to 3. And the color bars enabled.

Too bad this study cannot be converted to a custom watchlist column. I tried, but the script is just "too complex" for a watchlist column.

@samer800, thank you very much for converting this study to the ThinkScript format !
 
Last edited by a moderator:

Similar threads

Not the exact question you're looking for?

Start a new thread and receive assistance from our community.

87k+ Posts
385 Online
Create Post

Similar threads

Similar threads

The Market Trading Game Changer

Join 2,500+ subscribers inside the useThinkScript VIP Membership Club
  • Exclusive indicators
  • Proven strategies & setups
  • Private Discord community
  • ‘Buy The Dip’ signal alerts
  • Exclusive members-only content
  • Add-ons and resources
  • 1 full year of unlimited support

Frequently Asked Questions

What is useThinkScript?

useThinkScript is the #1 community of stock market investors using indicators and other tools to power their trading strategies. Traders of all skill levels use our forums to learn about scripting and indicators, help each other, and discover new ways to gain an edge in the markets.

How do I get started?

We get it. Our forum can be intimidating, if not overwhelming. With thousands of topics, tens of thousands of posts, our community has created an incredibly deep knowledge base for stock traders. No one can ever exhaust every resource provided on our site.

If you are new, or just looking for guidance, here are some helpful links to get you started.

What are the benefits of VIP Membership?
VIP members get exclusive access to these proven and tested premium indicators: Buy the Dip, Advanced Market Moves 2.0, Take Profit, and Volatility Trading Range. In addition, VIP members get access to over 50 VIP-only custom indicators, add-ons, and strategies, private VIP-only forums, private Discord channel to discuss trades and strategies in real-time, customer support, trade alerts, and much more. Learn all about VIP membership here.
How can I access the premium indicators?
To access the premium indicators, which are plug and play ready, sign up for VIP membership here.
Back
Top