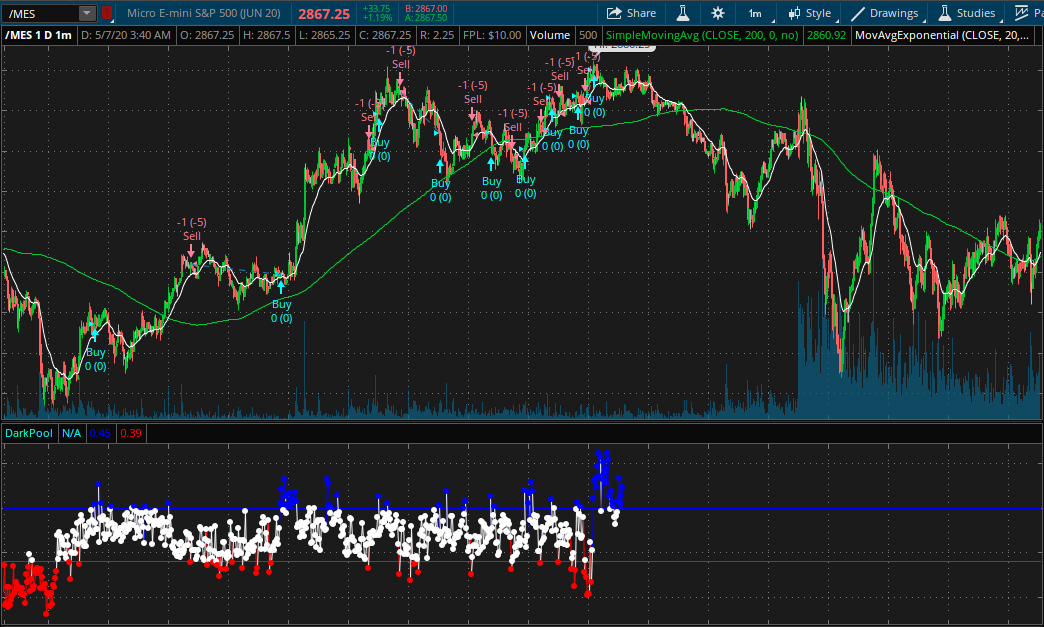
SqueezeMetrics Dark Pools Indicator for ThinkorSwim

I am interested in learning about his trading methodology, but not much info available as far as I can find.
It's powerful stuff. To start you might download Squeezemetric's whitepaper on GEX. Also start here:

https://squeezemetrics.com/monitor/docs

All this is to say, after 2 years of research, including dusting off my math degree from 25 years ago, and reading as much Quant stuff as I can find, Gamma Exposure is the stat that moves the market. Every major MM and Fund out there Dynamically or Statically hedges their Delta at market open and market close each and every day.
 

BenTen's Watchlist + Setup + Trade Recaps

Get access to Ben's watchlist, swing trading strategy, ThinkorSwim setup, and trade examples.

Learn more

I am interested in learning About his trading methodology, but not much info available as far as I can find.

The concepts are Gamma Exposure (GEX): a combo of Gamma Flip, Gamma P&L, and Gamma Volatility as relating to Static or Dynamic Delta Hedging (and highest open interest on the option chains). This is where the DarkPools ALL swim and eat.

The colored lines above represent: Gamma Flip - Red & Green w/yellow, Gamma P&L (Cyan) and Gamma volatility (Plum). You'll notice those levels are usually the hard stops on price reversals (not anything else, not breakout, not VWAP, not moving averages etc.)

Market makers try to keep Delta neutral throughout each week, balanced at market open and market close. They hedge using futures and inverse indexes, plus buying and selling premium on option chains as the Gamma is the most important stat as option chain weeklies near expiration Friday.

Market structure is setup each week, each month, each quarter. This has to do with money managers needing to fill quotas and their bonuses come end of quarter/end of year. MMs like to sell volatility as a means to generate additional cash flow, as well as selling premium on options (calls and puts). This is all based on heavy duty Quant research done by PhDs at major universities CalTech, Yale, Oxford, Penn, and many many others.

The daily volatility is measured as a variance from the past, calculated in 5m intervals or 30m intervals and re-arranged at market open and close usually every day, and certainly on Fridays/Mondays.

I have found it's best to trade stocks that have great Gamma profiles through lots of dynamic hedging, highly liquid, good spreads, good volatility with low-medium IV (20%-50%).
 
Last edited:
The concepts are Gamma Exposure (GEX): a combo of Gamma Flip, Gamma P&L, and Gamma Volatility as relating to Static or Dynamic Delta Hedging (and highest open interest on the option chains). This is where the DarkPools ALL swim and eat.
Would you be able to share the GEXV3 upper study?
 
I have never added my own script to TOS before and need some help. I downloaded the info from squeeze metrics (spreadsheet) and download your spreadsheet.

1. How do I smash/combine the spreadsheets appropriately?
2. Then copy everything and paste into a new custom strategy?

Thanks!
 
I have never added my own script to TOS before and need some help. I downloaded the info from squeeze metrics (spreadsheet) and download your spreadsheet.

1. How do I smash/combine the spreadsheets appropriately?
2. Then copy everything and paste into a new custom strategy?

Thanks!
do a search in this forum. i saw somebody else do it. i use myself. the trick is download the csv file somewhere, copy paste the values into the script, modify the range date on thinkorswim. it does work and yes, it is within the scope of this forum as it has been done before with a script
 
My partner and I put this together over 2 years worth of research and I coded it. We've started a prop fund. I can't share the indicator with the public. But if you have a desire to learn about how Gamma really moves the markets, I can share my insights with you provided you supply any questions you have.

could you please provide a clear example with a vanilla symbol? let's say the SPY. showing the gamma values when to enter, when not to enter, when to exit, when to hedge
 
There hasn't been this much dark pool buying since after the Covid crash. Evidently, the Fed put the word out that equities are "protected." Not even inflation, commodity prices, Biden and Putin can bring this market down...
 
There hasn't been this much dark pool buying since after the Covid crash. Evidently, the Fed put the word out that equities are "protected." Not even inflation, commodity prices, Biden and Putin can bring this market down...
Protected according to who? The majority of the Nasdaq is down 30% or more over the last few months
 
Protected according to who? The majority of the Nasdaq is down 30% or more over the last few months
The only charts that matter are the indices. There has been NO technical damage to the NQ, ES or YM. When the QQQs are at 167 you can complain about a real correction. BTW, the only individual stocks that matter are megacaps like AAPL, GOOG, AMZN & MSFT. And, technically, they are still in fine shape! The point is that the DIX has shown very solid buying, diverging from the lousy price action of late. Not surprisingly, the last three sessions have proven that the dark money was right again. Don't be fooled, free markets are dead and you have to trade accordingly.
 
Protected according to who? The majority of the Nasdaq is down 30% or more over the last few months
Doesn't mean it's finished a move lower either 2000 saw AMZN -95%, but hey guy, jump in there on a relief rally......
 
could you please provide a clear example with a vanilla symbol? let's say the SPY. showing the gamma values when to enter, when not to enter, when to exit, when to hedge
It's all calculated by Squeezemetrics formulas. There is a high value and a low value for each aggregation period. If you can figure out that you CAN plot that you can have it show on the chart. The other way to do it is use a spreadsheet and TOS export info from the chains.
See below for spreadsheet examples and Pivot Tables:

https://perfiliev.co.uk/market-commentary/how-to-calculate-gamma-exposure-and-zero-gamma-level/
 

New Indicator: Buy the Dip

Check out our Buy the Dip indicator and see how it can help you find profitable swing trading ideas. Scanner, watchlist columns, and add-ons are included.

Download the indicator

Thread starter Similar threads Forum Replies Date
BenTen FlowAlgo Dark pool and Option Flow for ThinkorSwim Indicators 23

Similar threads

Not the exact question you're looking for?

Start a new thread and receive assistance from our community.

87k+ Posts
305 Online
Create Post

Similar threads

Similar threads

The Market Trading Game Changer

Join 2,500+ subscribers inside the useThinkScript VIP Membership Club
  • Exclusive indicators
  • Proven strategies & setups
  • Private Discord community
  • ‘Buy The Dip’ signal alerts
  • Exclusive members-only content
  • Add-ons and resources
  • 1 full year of unlimited support

Frequently Asked Questions

What is useThinkScript?

useThinkScript is the #1 community of stock market investors using indicators and other tools to power their trading strategies. Traders of all skill levels use our forums to learn about scripting and indicators, help each other, and discover new ways to gain an edge in the markets.

How do I get started?

We get it. Our forum can be intimidating, if not overwhelming. With thousands of topics, tens of thousands of posts, our community has created an incredibly deep knowledge base for stock traders. No one can ever exhaust every resource provided on our site.

If you are new, or just looking for guidance, here are some helpful links to get you started.

What are the benefits of VIP Membership?
VIP members get exclusive access to these proven and tested premium indicators: Buy the Dip, Advanced Market Moves 2.0, Take Profit, and Volatility Trading Range. In addition, VIP members get access to over 50 VIP-only custom indicators, add-ons, and strategies, private VIP-only forums, private Discord channel to discuss trades and strategies in real-time, customer support, trade alerts, and much more. Learn all about VIP membership here.
How can I access the premium indicators?
To access the premium indicators, which are plug and play ready, sign up for VIP membership here.
Back
Top