
This Squeeze Strategy incorporates RSI for momentum confirmation, volume analysis, and a signal line to identify potential breakout opportunities.
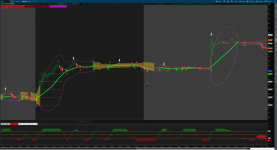
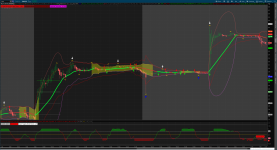
Squeeze condition occurs when Bollinger Bands are inside Keltner Channels
Bollinger Bands: Measure volatility and identify overbought/oversold conditions
Keltner Channels: Provide a trend-following envelope
HOW TO USE
Look for Squeeze Condition: When the "Bollinger Band Squeeze" label appears, it indicates a potential buildup of volatility
Monitor Squeeze Intensity: Lower intensity suggests a stronger potential breakout
Confirm Direction:
Watch for Breakouts:
Use the Signal Line:
Consider Volume: High volume (1.5x average) during a breakout suggests stronger conviction
Interpretation:
- Squeeze + High Intensity + Strong Directional Bias + High Volume Breakout = High Probability Trade
Setup
# Note: This indicator is for informational purposes only. Always conduct your own analysis and manage your risk appropriately.
Squeeze condition occurs when Bollinger Bands are inside Keltner Channels
Bollinger Bands: Measure volatility and identify overbought/oversold conditions
Keltner Channels: Provide a trend-following envelope
- RSI: Confirms momentum direction
- Volume Analysis: Helps confirm potential breakouts
- Linear Regression Slope: Indicates overall trend direction
- Squeeze Intensity: Measures how tight the squeeze is
- Signal Line: 9-period moving average for additional trend confirmation
HOW TO USE
Look for Squeeze Condition: When the "Bollinger Band Squeeze" label appears, it indicates a potential buildup of volatility
Monitor Squeeze Intensity: Lower intensity suggests a stronger potential breakout
Confirm Direction:
- Use the "Direction" label to identify the overall trend
- Strong trends are indicated when slope and RSI agree (e.g., "Strong Upward Trend")
Watch for Breakouts:
- When the squeeze ends (Bollinger Bands move outside Keltner Channels)
- Confirm with the "Potential Breakout" label, which also considers volume
Use the Signal Line:
- Price crossing above the signal line may indicate a bullish move
- Price crossing below may indicate a bearish move
Consider Volume: High volume (1.5x average) during a breakout suggests stronger conviction
Interpretation:
- Squeeze + High Intensity + Strong Directional Bias + High Volume Breakout = High Probability Trade
Setup
- Always use in conjunction with other analysis and risk management techniques
- Adjust input parameters to fit your specific trading timeframe and style
# Note: This indicator is for informational purposes only. Always conduct your own analysis and manage your risk appropriately.
Ruby:
# Bollinger Band Squeeze Strategy using Keltner Channels
# Define input series
input length = 20;
input numDevDn = 2.0;
input numDevUp = 2.0;
input atrLength = 10;
input cloudOpacity = 50; # Adjust this value to control cloud opacity (0 to 100)
input rsiLength = 14; # RSI length for momentum confirmation

# Calculate Bollinger Bands
def middleBB = Average(close, length);
def stDev = StDev(close, length);
def lowerBB = middleBB - numDevDn * stDev;
def upperBB = middleBB + numDevUp * stDev;

# Calculate Keltner Channels (using EMA and ATR)
def emaLength = 20;
def keltnerMiddle = ExpAverage(close, emaLength);
def keltnerATR = MovingAverage(AverageType.EXPONENTIAL, TrueRange(high, close, low), atrLength);
def keltnerUpper = keltnerMiddle + numDevUp * keltnerATR;
def keltnerLower = keltnerMiddle - numDevDn * keltnerATR;

# Check for Bollinger Band squeeze condition
def bollingerSqueeze = lowerBB > keltnerLower and upperBB < keltnerUpper;

# Calculate the slope of the linear regression line of closing prices
def regressionLength = 20; # You can adjust this period for the regression calculation
def priceChange = close - close[regressionLength];
def sumX = Sum(1, regressionLength);
def sumXY = Sum(priceChange * BarNumber(), regressionLength);
def sumX2 = Sum(Sqr(BarNumber()), regressionLength);
def slope = (regressionLength * sumXY - sumX * Sum(priceChange, regressionLength)) / (regressionLength * sumX2 - Sqr(sumX));

# Calculate RSI for momentum confirmation
def rsi = RSI(length = rsiLength);

# Calculate squeeze intensity
def squeezeIntensity = AbsValue((upperBB - lowerBB) / (keltnerUpper - keltnerLower));

# Create plot for Bollinger Bands and Keltner Channels
plot bollingerUpper = if bollingerSqueeze then upperBB else Double.NaN;
plot bollingerLower = if bollingerSqueeze then lowerBB else Double.NaN;
plot keltnerUpperPlot = keltnerUpper;
plot keltnerLowerPlot = keltnerLower;

# Color customization
bollingerUpper.SetDefaultColor(Color.GREEN);
bollingerLower.SetDefaultColor(Color.GREEN);
keltnerUpperPlot.SetDefaultColor(Color.RED);
keltnerLowerPlot.SetDefaultColor(Color.RED);

# Add label for Bollinger Band squeeze condition
AddLabel(bollingerSqueeze, "Bollinger Band Squeeze", Color.CYAN);

# Create colored rectangles for Bollinger Bands and Keltner Channels with adjustable opacity
AddCloud(bollingerUpper, bollingerLower, Color.YELLOW, Color.YELLOW, cloudOpacity);

# Alert indicating the direction of the stock with RSI confirmation
AddLabel(yes, "Direction: " +
if slope > 0 and rsi > 50 then "Strong Upward Trend BB KC"
else if slope > 0 and rsi <= 50 then "Weak Upward Trend BB KC"
else if slope < 0 and rsi < 50 then "Strong Downward Trend BB KC"
else if slope < 0 and rsi >= 50 then "Weak Downward Trend BB KC"
else "Sideways Trend",
if slope > 0 and rsi > 50 then Color.DARK_GREEN
else if slope > 0 and rsi <= 50 then Color.GREEN
else if slope < 0 and rsi < 50 then Color.DARK_RED
else if slope < 0 and rsi >= 50 then Color.RED
else Color.GRAY);

# Add squeeze intensity label
AddLabel(yes, "Squeeze Intensity: " + AsPercent(squeezeIntensity), Color.MAGENTA);

# Add volume analysis
def volumeAvg = Average(volume, 20);
def highVolume = volume > 1.5 * volumeAvg;

# Signal line (simple moving average of close price)
def signalLine = Average(close, 9);
plot SignalLinePlot = signalLine;
SignalLinePlot.SetDefaultColor(Color.WHITE);

# Potential breakout signal
def potentialBreakout = bollingerSqueeze[1] and !bollingerSqueeze and highVolume;
AddLabel(potentialBreakout, "Potential Breakout", Color.YELLOW);
Attachments
Last edited: