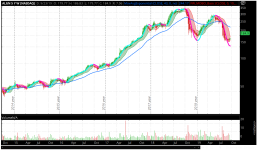
This is a great chart to help determine long term action as well as signs of a breakdown
Other uses:
I use this chart to see if I am buying into a counter trend rally. Also, excellent for ETF's and 401k's, IMO.
Open the chart and check for clues.
BTW, my short term, "be careful" signal is when the Hull MA changes polarity. My absolute time to get in/out signal comes at the cross of the 43 week EMA. Your signal should be what you make it.
Code:
https://tos.mx/r5TdS5jAttachments
Last edited by a moderator:

