
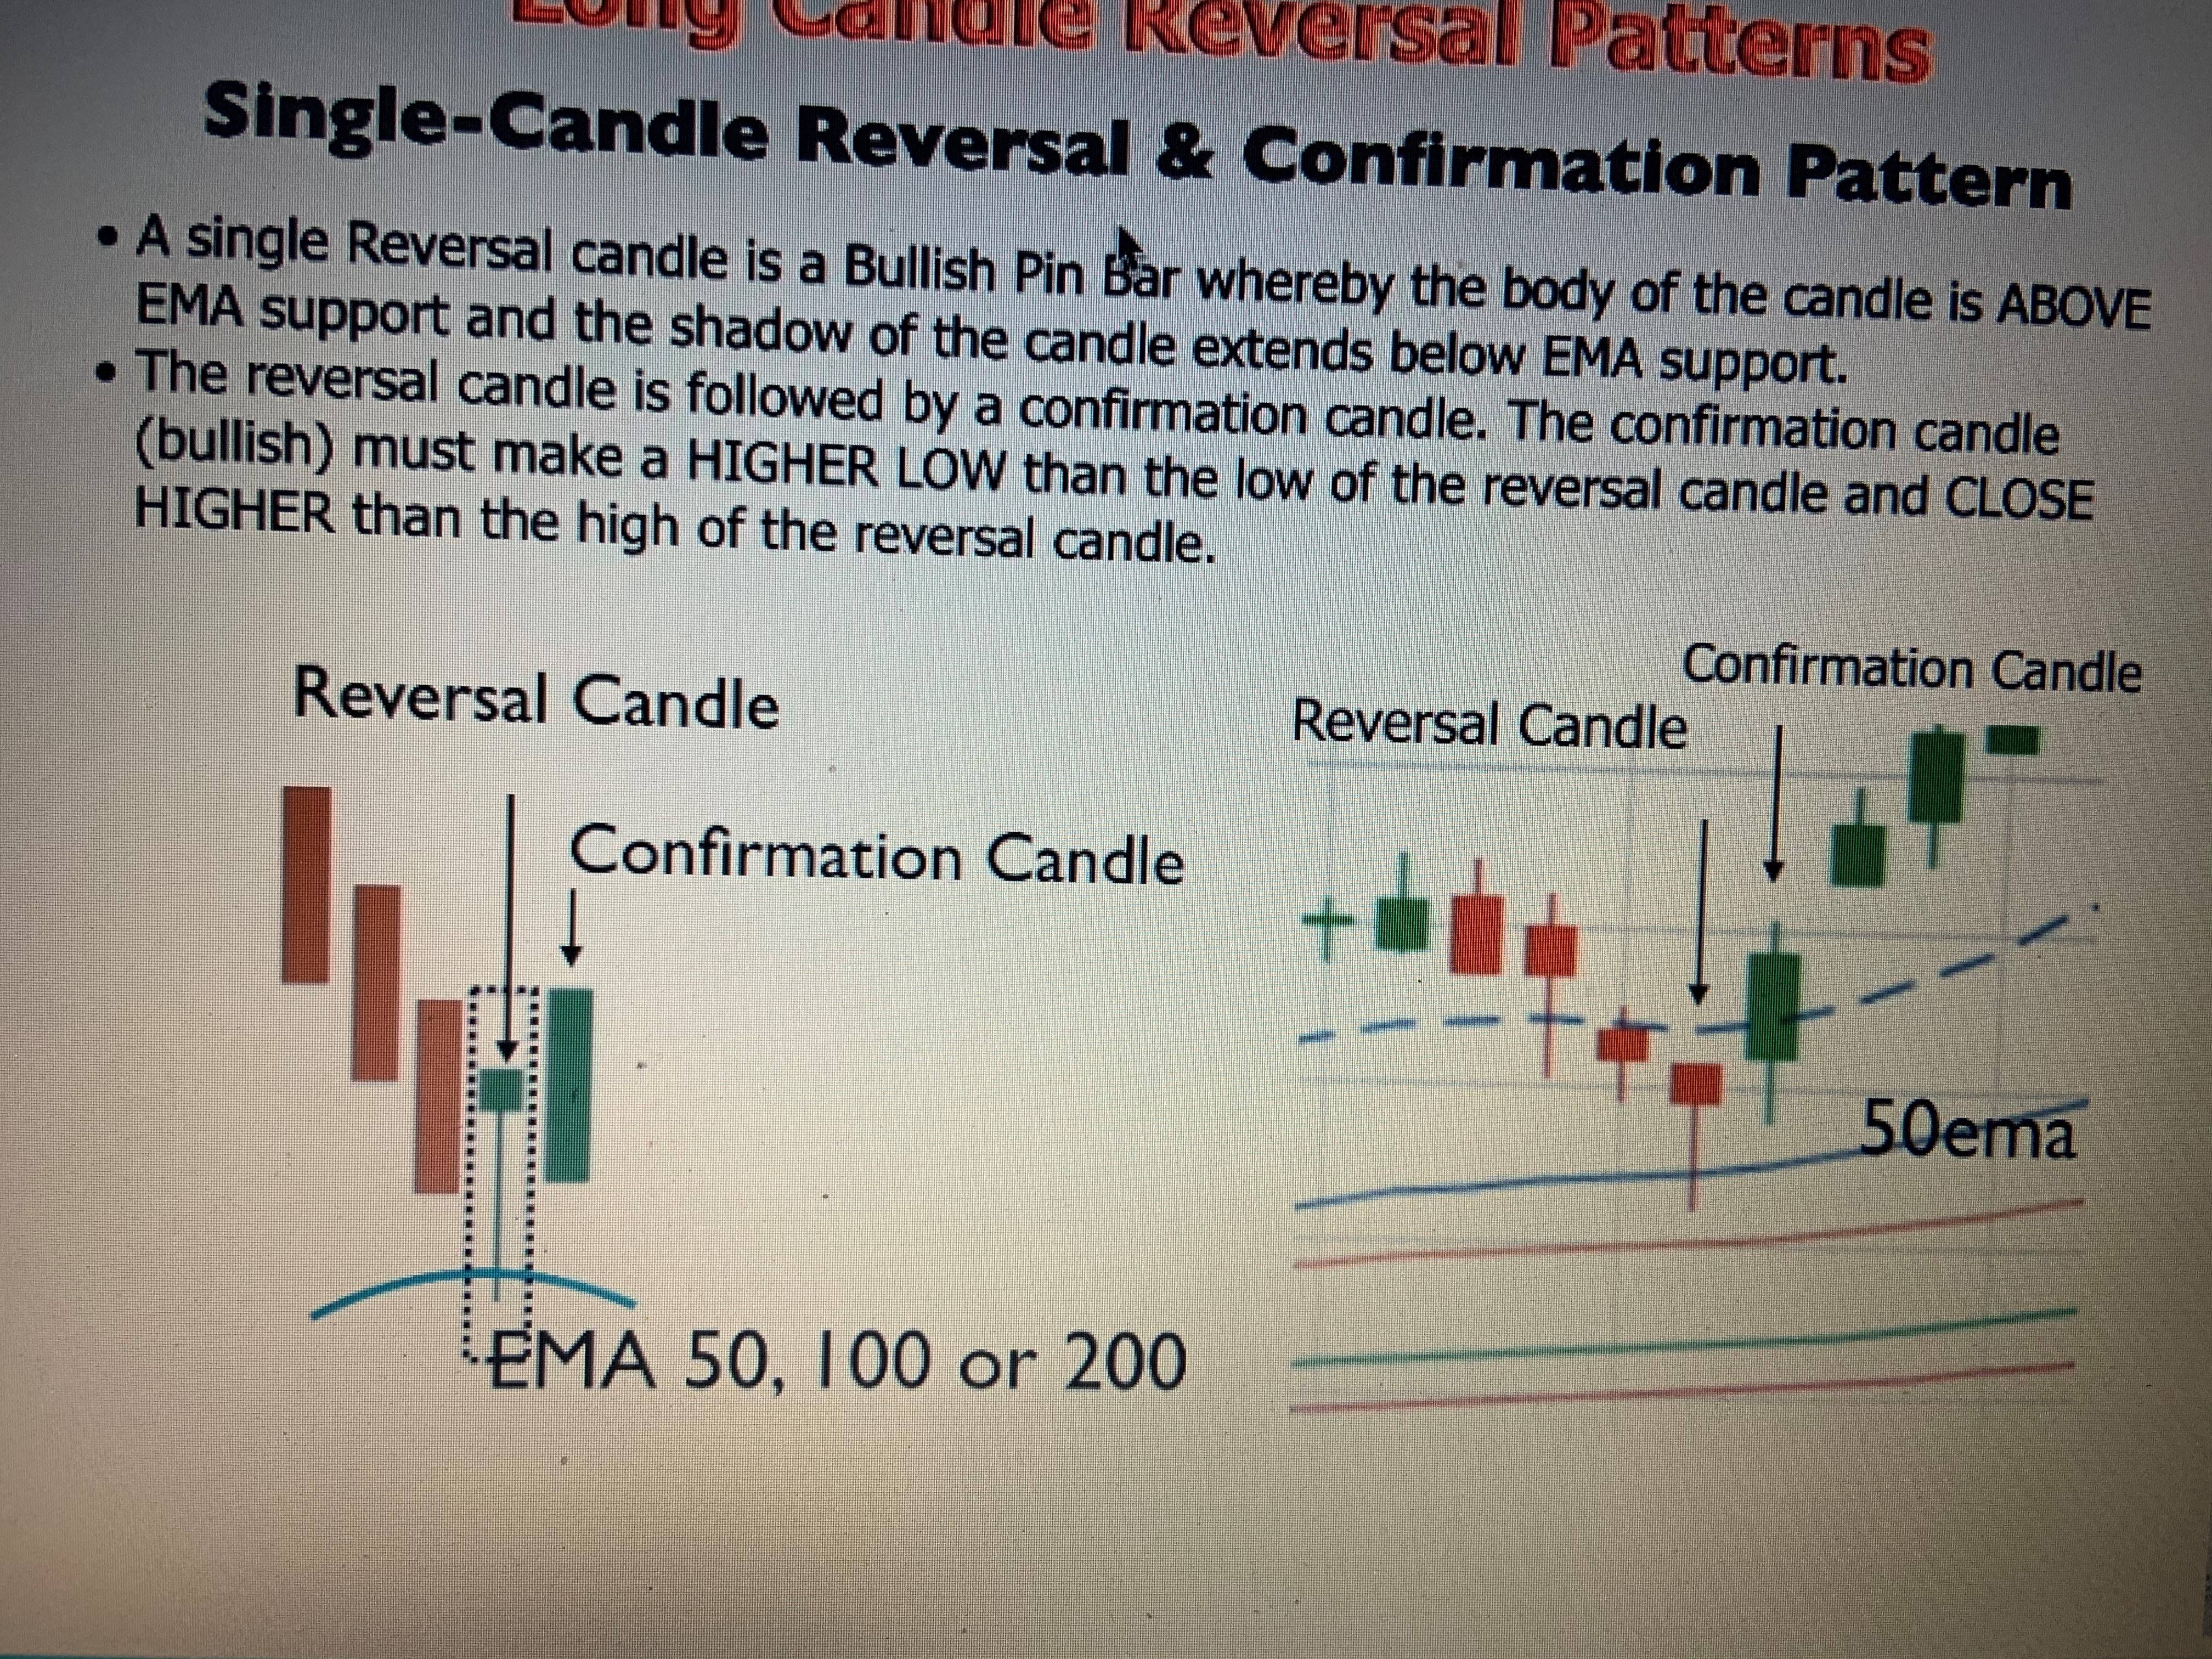
A Single Reversal Candle is a Bullish Pin Bar whereby the Body of the candle is ABOVE EMA(50, 100 or 200) support and the shadow of the candle extends below EMA (50, 100 or 200)support.
The Reversal Candle is followed by a confirmation candle. The confirmation candle( bullish) must make a HIGHER LOW than the low of the reversal candle and CLOSE HIGHER than the high of reversal candle.
 [/URL]
Conditions i am looking for
1) The body of the Bullish Pin( Reversal Candle) bar must be above the EMA
2) The Lower Shadow of that Reversal Candle( Wick) must cut below the EMA
3) Reversal Candle must be follow by a Bullish Candle
4) Confirmation Candle must make Higher Low then the low of the reversal candle and close higher than the high of the Candle.
Would it be possible to put an alert Green Arrow(Buy) on the Confirmation Candle and Red Arrow( Sell) when its time to exit.
The Reversal Candle is followed by a confirmation candle. The confirmation candle( bullish) must make a HIGHER LOW than the low of the reversal candle and CLOSE HIGHER than the high of reversal candle.
Conditions i am looking for
1) The body of the Bullish Pin( Reversal Candle) bar must be above the EMA
2) The Lower Shadow of that Reversal Candle( Wick) must cut below the EMA
3) Reversal Candle must be follow by a Bullish Candle
4) Confirmation Candle must make Higher Low then the low of the reversal candle and close higher than the high of the Candle.
Would it be possible to put an alert Green Arrow(Buy) on the Confirmation Candle and Red Arrow( Sell) when its time to exit.
Last edited:
")