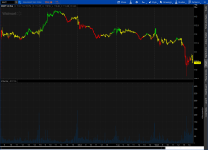
Updated the study allowing user input of the High and low threshold values. User can now adjust those levels and the length input without having to modify the code.
Seems good at showing change of direction with length 2, exponential, 58, 38 . Play till you get what you want.
Old study is below.
Since people requested color candles. One of many color candles indicators. Play with settings to adjust to your preference or time frame. Shown is 5 min. Length 12.

Seems good at showing change of direction with length 2, exponential, 58, 38 . Play till you get what you want.
Code:
## RSI Modified for Charlie Baker, by Waylock on June 19, 2016
## Color Price Chart based on 40 -60 Level

Input Length = 16;
Input AverageType = AverageType.WILDERS;

Def Price = (High + Low + Close) / 6;
Def NetChgAvg = MovingAverage(AverageType, Price - Price[1], Length);
Def TotChgAvg = MovingAverage(AverageType, AbsValue(Price - Price[1]), Length);
Def ChgRatio = if TotChgAvg != 0 then NetChgAvg / TotChgAvg else 0;
Def RSI = 50 * (ChgRatio + 1);
Def AvgExp = ExpAverage(RSI, 3);

input hv = 60;
input lv = 40;
AssignPriceColor(if AvgExp >hv then Color.GREEN else if AvgExp < lv then Color.RED else Color.YELLOW);
Old study is below.
Since people requested color candles. One of many color candles indicators. Play with settings to adjust to your preference or time frame. Shown is 5 min. Length 12.
Code:
## RSI Modified for Charlie Baker, by Waylock on June 19, 2016
## Color Price Chart based on 40 -60 Level

Input Length = 16;
Input AverageType = AverageType.WILDERS;

Def Price = (High + Low + Close) / 3;
Def NetChgAvg = MovingAverage(AverageType, Price - Price[1], Length);
Def TotChgAvg = MovingAverage(AverageType, AbsValue(Price - Price[1]), Length);
Def ChgRatio = if TotChgAvg != 0 then NetChgAvg / TotChgAvg else 0;
Def RSI = 50 * (ChgRatio + 1);
Def AvgExp = ExpAverage(RSI, 3);

AssignPriceColor(if AvgExp > 58 then Color.GREEN else if AvgExp < 38 then Color.RED else Color.YELLOW);
Attachments
Last edited:

