Colored Candles RSI based for ThinkorSwim

horserider

Well-known member
VIP
Updated the study allowing user input of the High and low threshold values. User can now adjust those levels and the length input without having to modify the code.
Seems good at showing change of direction with length 2, exponential, 58, 38 . Play till you get what you want.

Code:
## RSI Modified for Charlie Baker, by Waylock on June 19, 2016
## Color Price Chart based on 40 -60 Level

Input Length = 16;
Input AverageType = AverageType.WILDERS;

Def Price = (High + Low + Close) / 6;
Def NetChgAvg = MovingAverage(AverageType, Price - Price[1], Length);
Def TotChgAvg = MovingAverage(AverageType, AbsValue(Price - Price[1]), Length);
Def ChgRatio = if TotChgAvg != 0 then NetChgAvg / TotChgAvg else 0;
Def RSI = 50 * (ChgRatio + 1);
Def AvgExp = ExpAverage(RSI, 3);

input hv = 60;
input lv = 40;
AssignPriceColor(if AvgExp >hv then Color.GREEN else if AvgExp < lv then Color.RED else Color.YELLOW);


Old study is below.
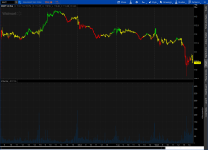
Since people requested color candles. One of many color candles indicators. Play with settings to adjust to your preference or time frame. Shown is 5 min. Length 12.

Ix9mtXb.png


Code:
## RSI Modified for Charlie Baker, by Waylock on June 19, 2016
## Color Price Chart based on 40 -60 Level

Input Length = 16;
Input AverageType = AverageType.WILDERS;

Def Price = (High + Low + Close) / 3;
Def NetChgAvg = MovingAverage(AverageType, Price - Price[1], Length);
Def TotChgAvg = MovingAverage(AverageType, AbsValue(Price - Price[1]), Length);
Def ChgRatio = if TotChgAvg != 0 then NetChgAvg / TotChgAvg else 0;
Def RSI = 50 * (ChgRatio + 1);
Def AvgExp = ExpAverage(RSI, 3);

AssignPriceColor(if AvgExp > 58 then Color.GREEN else if AvgExp < 38 then Color.RED else Color.YELLOW);
 

Attachments

  • Ix9mtXb.png
    Ix9mtXb.png
    67.8 KB · Views: 182
Last edited:
Found this RSI on Tradeview with a very interesting plotting to it i was wondering if anyone can help me edit it so far i keep running into walls have taken rsi studies in order to modified and yet it has been failures, if anyone can help out that would be great and it will also show me were i'm failing, thank you.

Code:
//@version=3
study(title="Chop and explode", shorttitle="CAE")

src = close, len = input(14, minval=1, title="Length")
up = rma(max(change(src), 0), len)
down = rma(-min(change(src), 0), len)
rsi = down == 0 ? 100 : up == 0 ? 0 : 100 - (100 / (1 + up / down))

plot(rsi, color=black)

change1 = rsi > 60 ? blue :na
change2= rsi < 40 ? purple: na

p1 = plot(rsi, style=linebr, linewidth=3, color=change1)
p2 = plot(rsi, style=linebr, linewidth=3, color=change2)


band1 = hline(70)
band2 = hline(30)
band3 = hline (60)
band4 = hline (40)
midline= hline (50)
band5=hline(55)
band6=hline(45)
fill(band1, band3, color=green, transp=90)
fill(band3, band4, color=yellow, transp=90)
fill(band4, band2, color=red, transp=90)
fill (band5,band6, color=black, transp=50)

cond1 = rsi > 60 and close[1] < rsi and close > 0 ? 1 : 0
barcolor(cond1 ? blue : na)

cond2 = rsi < 40 and close[1] < rsi and close > 0 ? 1 : 0
barcolor(cond2 ? purple : na)

cond3 = rsi > 55 and close[1] < rsi and close < 60 ? 1 : 0
barcolor(cond3 ? yellow : na)

cond4 = rsi > 45 and close[1] < rsi and close [1] < 55 ? 1 : 0
barcolor(cond4 ? black : na)

cond5 = rsi > 40 and close[1] < rsi and close [1] < 55 ? 1 : 0
barcolor(cond5 ? yellow : na)
 
Last edited:
I made a few modifications to horserider's original post to give this indicator a few more RSI zones. I've used it on the 5 min for a few scalps on pullbacks to VWAP (beware if there is a news catalyst though, sometimes it will keep pushing through!). Looking at the past daily chart some bottoms and tops really jump out at you. I also like it for pullbacks if the trend is intact. After the candle turns yellow and settles against a MA look for it to continue after changing back in the way of the trend.


Code:
## RSI Modified for Charlie Baker, by Waylock on June 19, 2016
## Color Price Chart based on 40 -60 Level
## Modified for more zones

Input Length = 7;
Input AverageType = AverageType.WILDERS;

Def Price = (High + Low + Close) / 6;
Def NetChgAvg = MovingAverage(AverageType, Price - Price[1], Length);
Def TotChgAvg = MovingAverage(AverageType, AbsValue(Price - Price[1]), Length);
Def ChgRatio = if TotChgAvg != 0 then NetChgAvg / TotChgAvg else 0;
Def RSI = 50 * (ChgRatio + 1);
Def AvgExp = ExpAverage(RSI, 3);

input hv = 60;
input lv = 40;
input hvh = 80;
input lvl = 20;
input hvhh = 90;
input lvll = 10;
input hvhhh = 95;
input lvlll = 5;

AssignPriceColor(if AvgExp <lvlll then Color.BLACK else if AvgExp >hvhhh then Color.BLUE else if AvgExp <lvll then Color.DARK_GRAY else if AvgExp >hvhh then Color.CYAN else if AvgExp <lvl then Color.DARK_RED else if AvgExp >hvh then Color.DaRK_GREEN else if AvgExp >hv then Color.green else if AvgExp < lv then Color.red else Color.YELLOW);
 
AssignPriceColor(if AvgExp <lvlll then Color.BLACK else if AvgExp >hvhhh then Color.BLUE else if AvgExp <lvll then Color.DARK_GRAY else if AvgExp >hvhh then Color.CYAN else if AvgExp <lvl then Color.DARK_RED else if AvgExp >hvh then Color.DaRK_GREEN else if AvgExp >hv then Color.green else if AvgExp < lv then Color.red else Color.YELLOW);

Can you explain the meaning of the colored bars? like Dark Red, Dark Green, Cyan?
 
HI, any one know how to convert this pine scrip into think scrip? i will be thankful.

Code:
src = close, len = input(14, minval=1, title="Length")
up = rma(max(change(src), 0), len)
down = rma(-min(change(src), 0), len)
rsi = down == 0 ? 100 : up == 0 ? 0 : 100 - (100 / (1 + up / down))

plot(rsi, color=black)
 
Hi, can Anyone of you fine coders help me code a simple indicator that Makes the candles change color when the rsi is overbought or oversold? For example, if rsi is 80 or above color the candles purple. If rsi is 20 or less color the candles yellow. I think this might be a really good strategy. Going long if rsi is above 80 And exiting when rsi dips below 80.

Thanks!
 
I have a thinkscript I have put together that makes a candle turn PINK if the RSI is less than 30 and the price is currently trading above the 200sma and it works fine. But what I would like to do is first have a PINK candle which I have already coded. Then when the RSI gets back above 50 then turn the current candle BLUE. I need help with the BLUE part. Here is my code...

Code:
input length2 = 14;
input over_Bought = 80;
input over_Sold = 30;
input price = close;
input averageType = AverageType.WILDERS;
input showBreakoutSignals = no;

def NetChgAvg = MovingAverage(averageType, price - price[1], length2);
def TotChgAvg = MovingAverage(averageType, AbsValue(price - price[1]), length2);
def ChgRatio = if TotChgAvg != 0 then NetChgAvg / TotChgAvg else 0;

plot RSI = 50 * (ChgRatio + 1);
plot OverSold = over_Sold;
plot OverBought = over_Bought;
plot UpSignal = if RSI crosses above OverSold then OverSold else Double.NaN;
plot DownSignal = if RSI crosses below OverBought then OverBought else Double.NaN;

#####################
#the following turns a candle pink if the rsi is less than 30 and the price is trading above the 200sma.

input length3 = 200;
input displace = 0;
plot SMA = Average(price[-displace], length3);
SMA.Hide();
AssignPriceColor( if RSI < 30 and price > SMA
then Color.PINK
else Color.CURRENT);
 
@drkellog It looks like you didn't assign the second condition yet.

Something like this?

Code:
AssignPriceColor(if RSI < 30 and price > SMA then Color.PINK else if RSI > 50 and price > SMA then Color.Blue else Color.CURRENT);
 
@drkellog It looks like you didn't assign the second condition yet.

Something like this?

Code:
AssignPriceColor(if RSI < 30 and price > SMA then Color.PINK else if RSI > 50 and price > SMA then Color.Blue else Color.CURRENT);
Thank you BenTen. But that makes ALL of the candles blue. I just need the first candle to turn BLUE only after the first PINK candle. Think of the BLUE candle like a BREAKOUT SIGNAL or an UP ARROW. Just need one BLUE CANDLE. I like 99% of my candles to be their default colors. I just want to notice when the RSI triggers below 30 (PINK one candle only) and above 50 (BLUE one candle only)


something like this but I am not 100% on the syntax...

AssignPriceColor( if RSI > 50 and price > SMA
then Color.BLUE elseif Color.was_already_blue is true then Color.back_to_default
 
Last edited:
@drkellog It looks like you didn't assign the second condition yet.

Something like this?

Code:
AssignPriceColor(if RSI < 30 and price > SMA then Color.PINK else if RSI > 50 and price > SMA then Color.Blue else Color.CURRENT);
what would be the code if i want candles to be green when above 50 ON the RSI, AND rED WHEN BELOW THE 50 line on the Rsi? any assistance would be greatly appreciated
 
what would be the code if i want candles to be green when above 50 ON the RSI, AND rED WHEN BELOW THE 50 line on the Rsi? any assistance would be greatly appreciated
Hi @Nari2007,
I had this on hand. I hope it helps!
Code:
declare upper;

input length = 14;
input over_Bought = 70;
input over_Sold = 30;
input price = close;
input averageType = AverageType.WILDERS;
input showBreakoutSignals = no;
input ColoredCandlesOn = yes;

def NetChgAvg = MovingAverage(averageType, price - price[1], length);
def TotChgAvg = MovingAverage(averageType, AbsValue(price - price[1]), length);
def ChgRatio = if TotChgAvg != 0 then NetChgAvg / TotChgAvg else 0;

def RSI = 50 * (ChgRatio + 1);
def OverSold = over_Sold;
def OverBought = over_Bought;

def UP = RSI > 50;
def DN = RSI < 50;
def UpCalc = UP - DN;

def CandleColor = if (UpCalc > 0) then 1
                 else if (UpCalc < 0) then -1
                 else 0;# CandleColor[1];
AssignPriceColor(if coloredCandlesOn and (CandleColor == 1) then Color.GREEN else if coloredCandlesOn and (CandleColor == -1) then Color.RED else Color.GRAY);
 
Very cool. I got this study on a chart with the Mobius candle study on a 2nd chart to compare. I like this study because cleans up the screen as I'm using a low resolution monitor . I've bookmarked this study in my thinkscript boomark folder.
 

Join useThinkScript to post your question to a community of 21,000+ developers and traders.

Similar threads

Not the exact question you're looking for?

Start a new thread and receive assistance from our community.

87k+ Posts
506 Online
Create Post

Similar threads

Similar threads

The Market Trading Game Changer

Join 2,500+ subscribers inside the useThinkScript VIP Membership Club
  • Exclusive indicators
  • Proven strategies & setups
  • Private Discord community
  • ‘Buy The Dip’ signal alerts
  • Exclusive members-only content
  • Add-ons and resources
  • 1 full year of unlimited support

Frequently Asked Questions

What is useThinkScript?

useThinkScript is the #1 community of stock market investors using indicators and other tools to power their trading strategies. Traders of all skill levels use our forums to learn about scripting and indicators, help each other, and discover new ways to gain an edge in the markets.

How do I get started?

We get it. Our forum can be intimidating, if not overwhelming. With thousands of topics, tens of thousands of posts, our community has created an incredibly deep knowledge base for stock traders. No one can ever exhaust every resource provided on our site.

If you are new, or just looking for guidance, here are some helpful links to get you started.

What are the benefits of VIP Membership?
VIP members get exclusive access to these proven and tested premium indicators: Buy the Dip, Advanced Market Moves 2.0, Take Profit, and Volatility Trading Range. In addition, VIP members get access to over 50 VIP-only custom indicators, add-ons, and strategies, private VIP-only forums, private Discord channel to discuss trades and strategies in real-time, customer support, trade alerts, and much more. Learn all about VIP membership here.
How can I access the premium indicators?
To access the premium indicators, which are plug and play ready, sign up for VIP membership here.
Back
Top