this is not a tool to find trades.
it shows, what if you had made a trade on every move, how much would that might add up to be.
it tries to show, that by capturing just a part of a move, money can be made.
you don't have to find the exact bottom, or the top.
have you asked yourself, what if i would have caught some of that move?
this tries to answer that, by adding up gains over part of every move on a chart.
it defines moves as,
. LONG trade - between a valley and a peak
. SHORT trade - between a peak and a valley
user picks a percentage of the price difference, between a valley and peak.
default is 50%
this percentage is what they think they would have been able to capture in a trade.
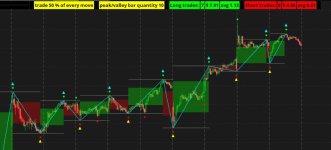
red and green clouds show the price range of the %, for each period.
labels show,
. the %,
. length number defining peaks/valleys
. long trades - qty of trades, total $, and average
. short trades - qty of trades, total $, and average
--------------
a peak is defined as the highest high of 10 previous bars and 10 future bars.
a valley is the lowest low.
default bar quantity is 10
all peaks and valleys have dots on them.
sometimes there are 2 peaks in a row. this study will pick one, whichever is highest.
similar with valleys.
these extreme peaks and valleys are marked with a triangle.
diagonal lines are drawn between the peaks and valleys with triangles.
a peak and a valley can't be on the same bar, or 1 bar apart. (a period has to be 3+ bars long)
it calculates the price change from the valley and peak. (the height)
this ignores times when bars move higher than a peak level or lower than a valley level, within a trade period. it happens so rarely, i didn't think it was worth the extra code.
the period after the last peak or valley is ignored.
i came up with formulas for spacing 2 shapes vertically. it seems to work for most prices, meaning the dot and trinagle are not too close or on top of each other, nor too far apart. (based on price and ATR , y= )
it shows, what if you had made a trade on every move, how much would that might add up to be.
it tries to show, that by capturing just a part of a move, money can be made.
you don't have to find the exact bottom, or the top.
have you asked yourself, what if i would have caught some of that move?
this tries to answer that, by adding up gains over part of every move on a chart.
it defines moves as,
. LONG trade - between a valley and a peak
. SHORT trade - between a peak and a valley
user picks a percentage of the price difference, between a valley and peak.
default is 50%
this percentage is what they think they would have been able to capture in a trade.
red and green clouds show the price range of the %, for each period.
labels show,
. the %,
. length number defining peaks/valleys
. long trades - qty of trades, total $, and average
. short trades - qty of trades, total $, and average
--------------
a peak is defined as the highest high of 10 previous bars and 10 future bars.
a valley is the lowest low.
default bar quantity is 10
all peaks and valleys have dots on them.
sometimes there are 2 peaks in a row. this study will pick one, whichever is highest.
similar with valleys.
these extreme peaks and valleys are marked with a triangle.
diagonal lines are drawn between the peaks and valleys with triangles.
a peak and a valley can't be on the same bar, or 1 bar apart. (a period has to be 3+ bars long)
it calculates the price change from the valley and peak. (the height)
this ignores times when bars move higher than a peak level or lower than a valley level, within a trade period. it happens so rarely, i didn't think it was worth the extra code.
the period after the last peak or valley is ignored.
i came up with formulas for spacing 2 shapes vertically. it seems to work for most prices, meaning the dot and trinagle are not too close or on top of each other, nor too far apart. (based on price and ATR , y= )
Code:
#peaks_skip_same_00g

def na = double.nan;
def bn = BarNumber();
#def lastBar = HighestAll(if IsNaN(close) then 0 else bn);
def lastbn = HighestAll(if IsNaN(close) then 0 else bn);
def lastbar = bn == lastbn;
#def lastbar = (!isnan(close) and isnan(close[-1]));

def yr = getyear();
def newyr = yr != yr[1];
addverticalline(newyr, getyear(), color.cyan);


def ATR = MovingAverage(AverageType.WILDERS, TrueRange(high, close, low), 14);
#addlabel(1, "ATR " + atr, color.yellow);

#def y = 0.003;
def y;
if bn > 1 then {
 y = y[1];
} else {
 y = if close < 50 then 0.016 * atr
 else if close < 120 then 0.006 * atr
 else if close < 320 then 0.003 * atr
 else 0.0015 * atr;
}

input trade_percent_of_move = 50;
input calc_long_trades = yes;
input calc_short_trades = yes;
addlabel(1, "  ", color.black);
addlabel(1, "trade " + trade_percent_of_move + " % of every move", color.yellow);


# https://usethinkscript.com/threads/zigzag-high-low-with-supply-demand-zones-for-thinkorswim.172/#post-7048
#    Robert Payne
# define peaks / valleys
def highx = high;
def lowx = low;
input length = 10;
#hint length: "Enter a length for determining peaks and valleys, quantity of bars before and after current bar"

addlabel(1, "  ", color.black);
addlabel(1, "peak/valley bar quantity " + length, color.yellow);

# chg offset so lastbar cant be peak valley. so offset >= 1 ?
def offset = Min(length - 1, lastbn - bn);
def peak2 = highx > Highest(highx[1], length - 1) and highx == GetValue(Highest(highx, length), -offset);
def valley2 = lowx < Lowest(lowx[1], length - 1) and lowx == GetValue(Lowest(lowx, length), -offset);

# ignore peak-valley on same bar
#def peak = if peak2 and valley2 then 0 else if peak2 then 1 else 0;
#def valley = if valley2 and peak2 then 0 else if valley2 then 1 else 0;
# ignore lastbar
def peak = if (peak2 and valley2) or lastbar then 0 else if peak2 then 1 else 0;
def valley = if (valley2 and peak2) or lastbar then 0 else if valley2 then 1 else 0;

plot zhi = if peak then (high*(1+y)) else na;
plot zlo = if valley then (low*(1-y)) else na;
zhi.SetPaintingStrategy(PaintingStrategy.points);
zhi.SetDefaultColor(Color.green);
zhi.setlineweight(2);
zhi.hidebubble();
zlo.SetPaintingStrategy(PaintingStrategy.points);
zlo.SetDefaultColor(Color.red);
zlo.setlineweight(2);
zlo.hidebubble();


def n = 400;
# remove 1, if 2 in a row of same.
def dir;
def poff;
def voff;
if bn == 1 then {
 dir = 0;
 poff = 0;
 voff = 0;
} else if valley and !peak[1] and !lastbar then {
# a valley , rising
 poff = fold a1 = 1 to n
  with b1 = 1
  while !getvalue(peak, -a1) and !isnan(getvalue(close,-a1))
  do b1+1;

 voff = fold a2 = 1 to n
  with b2 = 1
  while !getvalue(valley, -a2) and !isnan(getvalue(close,-a2))
  do b2+1;

 dir = (if isnan(getvalue(close,-voff)) then 1
  else if voff < poff and low < getvalue(low, -(voff)) then 1
  else if voff > poff then 1
  else dir[1]);

} else if peak and !valley[1] and !lastbar then {
#  a peak, dropping
 poff = fold a3 = 1 to n
  with b3 = 1
  while !getvalue(peak, -a3) and !isnan(getvalue(close,-a3))
  do b3+1;

 voff = fold a4 = 1 to n
  with b4 = 1
  while !getvalue(valley, -a4) and !isnan(getvalue(close,-a4))
  do b4+1;

 dir = (if isnan(getvalue(close,-poff)) then -1
  else if poff < voff and high > getvalue(high, -(poff)) then -1
  else if  poff > voff then -1
  else dir[1]);

} else {
 dir = dir[1];
 poff = poff[1];
 voff = voff[1];
}

#-------------------

# define peaks and valleys that skip over 2 of same in a row
def peak3 = (dir == -1 and dir[1] != -1);
def valley3 = (dir == 1 and dir[1] != 1);

#-------------------

plot zhi2 = if peak3 then (high*(1+(2*y))) else na;
plot zlo2 = if valley3 then (low*(1-(2*y))) else na;
zhi2.SetPaintingStrategy(PaintingStrategy.triangles);
zhi2.SetDefaultColor(Color.cyan);
zhi2.setlineweight(3);
zhi2.hidebubble();
zlo2.SetPaintingStrategy(PaintingStrategy.triangles);
zlo2.SetDefaultColor(Color.yellow);
zlo2.setlineweight(3);
zlo2.hidebubble();

# plot a diagonal line, peak to valley to peak....
plot zz = if peak3 then high else if valley3 then low else na;
zz.EnableApproximation();
zz.SetDefaultColor(Color.cyan);
#zz.setlineweight(1);
zz.hidebubble();

#------------------------

# check if future peak/valley exists.
#  =1 if error
def perr = if bn == 1 then 0
 else if perr[1] == 1 then perr[1]
# else if peak3 and isnan(getvalue(high, -poff)) then 1
# else if valley3 and isnan(getvalue(high, -poff)) then 1
 else if (peak3 or valley3) and isnan(getvalue(high, -poff)) then 1
 else perr[1];

def verr = if bn == 1 then 0
 else if verr[1] == 1 then verr[1]
# else if valley3 and isnan(getvalue(low, -voff)) then 1
# else if peak3 and isnan(getvalue(low, -voff)) then 1
 else if (peak3 or valley3) and isnan(getvalue(low, -voff)) then 1
 else verr[1];

#------------------------

# long trades
#  bars after a valley to next peak
def val_barz;
def val_hi;
def val_lo;
def val_ht;
def val_hi_per;
def val_lo_per;
def val_per_ht;
if bn == 1 or peak3[1] or isnan(close) or (peak3 and verr) or (valley3 and perr) then {
 val_barz = 0;
 val_hi = 0;
 val_lo = 0;
 val_ht = 0;
 val_hi_per = 0;
 val_lo_per = 0;
 val_per_ht = 0;
} else if valley3 then {
 val_barz = fold c2 = 0 to n
  with d2
  while !getvalue(peak3, -c2)
  do d2 + 1;
 val_hi = if isnan(getvalue(high, -val_barz)) then val_lo[1] else getvalue(high, -val_barz);
 val_lo = low;
 val_ht = if isnan(getvalue(high, -val_barz)) then 0 else (val_hi - val_lo);
 val_hi_per = val_hi - (((100-trade_percent_of_move)/2)/100 * val_ht);
 val_lo_per = val_lo + (((100-trade_percent_of_move)/2)/100 * val_ht);
 val_per_ht = val_hi_per - val_lo_per;
} else {
 val_barz = val_barz[1];
 val_hi = val_hi[1];
 val_lo = val_lo[1];
 val_ht = val_ht[1];
 val_hi_per = val_hi_per[1];
 val_lo_per = val_lo_per[1];
 val_per_ht = val_per_ht[1];
}


plot zvalhi3 = if val_hi > 0 and calc_long_trades then val_hi else na;
plot zvallo3 = if val_lo > 0 and calc_long_trades then val_lo else na;
zvalhi3.SetDefaultColor(Color.gray);
zvalhi3.setlineweight(1);
zvalhi3.hidebubble();
zvallo3.SetDefaultColor(Color.gray);
zvallo3.setlineweight(1);
zvallo3.hidebubble();


def valcldtop = if calc_long_trades and val_hi_per > 0 then val_hi_per else na;
def valcldbot = if calc_long_trades and val_lo_per > 0 then val_lo_per else na;
addcloud(valcldtop, valcldbot, color.green);

#------------------

#  short trades
# bars after a peak to next valley
def pk_barz;
def pk_hi;
def pk_lo;
def pk_ht;
def pk_hi_per;
def pk_lo_per;
def pk_per_ht;
if bn == 1 or valley3[1] or isnan(close) or (peak3 and verr) or (valley3 and perr) then {
 pk_barz = 0;
 pk_hi = 0;
 pk_lo = 0;
 pk_ht = 0;
 pk_hi_per = 0;
 pk_lo_per = 0;
 pk_per_ht = 0;
} else if peak3 then {
 pk_barz = fold c1 = 0 to n
  with d1
  while !getvalue(valley3, -c1)
  do d1 + 1;
 pk_hi = high;
 pk_lo = if isnan(getvalue(low, -pk_barz)) then pk_lo[1] else getvalue(low, -pk_barz);
 pk_ht = if isnan(getvalue(low, -pk_barz)) then 0 else (pk_hi - pk_lo);
 pk_hi_per = pk_hi - (((100-trade_percent_of_move)/2)/100 * pk_ht);
 pk_lo_per = pk_lo + (((100-trade_percent_of_move)/2)/100 * pk_ht);
 pk_per_ht = pk_hi_per - pk_lo_per;
} else {
 pk_barz = pk_barz[1];
 pk_hi = pk_hi[1];
 pk_lo = pk_lo[1];
 pk_ht = pk_ht[1];
 pk_hi_per = pk_hi_per[1];
 pk_lo_per = pk_lo_per[1];
 pk_per_ht = pk_per_ht[1];
}

plot zpkhi3 = if pk_hi > 0 and calc_short_trades then pk_hi else na;
plot zpklo3 = if pk_lo > 0 and calc_short_trades then pk_lo else na;
zpkhi3.SetDefaultColor(Color.gray);
zpkhi3.setlineweight(1);
zpkhi3.hidebubble();
zpklo3.SetDefaultColor(Color.gray);
zpklo3.setlineweight(1);
zpklo3.hidebubble();


def pkcldtop = if calc_short_trades and pk_hi_per > 0 then pk_hi_per else na;
def pkcldbot = if calc_short_trades and pk_lo_per > 0 then pk_lo_per else na;
addcloud(pkcldtop, pkcldbot, color.red);

#------------------------

def long_cnt = if bn == 1 then 0
 else if valley3 then long_cnt[1] + 1
 else long_cnt[1];

def long_trades = if bn == 1 then 0
 else if isnan(val_per_ht) and !isnan(close) then round(val_per_ht[1],2)
 else if valley3 then round(long_trades[1] + val_per_ht,2)
 else long_trades[1];

addlabel(calc_long_trades, "  ", color.black);
addlabel(calc_long_trades, "Long trades:", color.green);
addlabel(calc_long_trades, long_cnt, color.green);
addlabel(calc_long_trades, "$ " + long_trades, color.green);
addlabel(calc_long_trades, "avg " + round((long_trades/long_cnt),2), color.green);


#------------------------

def short_cnt = if bn == 1 then 0
 else if peak3 then short_cnt[1] + 1
 else short_cnt[1];

def short_trades = if bn == 1 then 0
 else if isnan(pk_per_ht) and !isnan(close) then round(pk_per_ht[1],2)
 else if peak3 then round(short_trades[1] + pk_per_ht,2)
 else short_trades[1];

addlabel(calc_short_trades, "  ", color.black);
addlabel(calc_short_trades, "Short trades:", color.red);
addlabel(calc_short_trades, short_cnt, color.red);
addlabel(calc_short_trades, "$ " + short_trades, color.red);
addlabel(calc_short_trades, "avg " + round((short_trades/short_cnt),2), color.red);
addlabel(calc_short_trades, "  ", color.black);
#