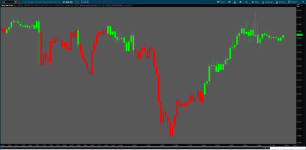
How do I create arrows for this script to plot on the chart, as long as the momentum is bullish i want an arrow to print, and as long as the momentum is bearish as well, I was able to assign the price color, but I'm not able to create the code to print an arrow, any help would be apprciated. Thanks
#Momentum Indicator
input length = 13;
input AvgMomentumLength = 13;
input price = close;
input AverageType = AverageType.EXPONENTIAL;
input showBreakoutSignals = no;
assert(length > 0, "'length' must be positive: " + length);
plot Momentum = price - price[length];
def AvgMomentum = movavgExponential(Momentum, AvgMomentumLength);
def bullishMomentum = AvgMomentum > 0;
def bearishMomentum = AvgMomentum < 0;
#AvgMomentum.SetPaintingStrategy(paintingstrategy.LINE);
#AvgMomentum.SetLineWeight(3);
AssignPriceColor(if bullishmomentum then color.green else if bearishMomentum then color.red else color.black);