Hello
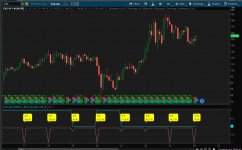
I created scan in ToS with monthly aggregation with below code to find stocks that are down in Jan month at least 80% of the time. However, it seems to be reporting incorrect results. When plotted this in the chart, it shows correct results but the scanner does not return correct data. What am I missing?
Note: I created scan by copying above code in thinkscript editor and selected aggregation as "Mo".
I created scan in ToS with monthly aggregation with below code to find stocks that are down in Jan month at least 80% of the time. However, it seems to be reporting incorrect results. When plotted this in the chart, it shows correct results but the scanner does not return correct data. What am I missing?
def targetMonth = getmonth() == 1;
def down = close < open;
def ctDownMonths = if targetMonth then down else 0;
rec totalMonths = if targetMonth then totalMonths[1] + 1 else totalMonths[1];
rec downMonths = if ctDownMonths then downMonths[1] + 1 else downMonths[1];
def percentDown = 100 * (downMonths / totalMonths);
plot signal = percentDown > 80;
Note: I created scan by copying above code in thinkscript editor and selected aggregation as "Mo".