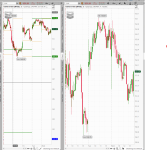
I have two charts below.
First chart on the left : Time span is 5days and time frame is 15 minutes.
Second chart on the right: Time Span is 3days and time frame is 15 minutes.
Both charts have TOS built High Low bubbles. [I use the TOS Chart Settings - General and have the show high/low bubbles checked and it displays the high /low bubbles on the chart correctly with the appropriate time span]
In the first chart below on left the time span is 5 days and 15 min time frame the High is 153.06 and the low is 149.22 which you can see on the chart
In the second chart on the right the time span is 3 Days and 15 min time frame the High is 153.01 and the low is 150.75 which you can see on the chart
This is my request. I need to scan for the stocks where the difference between the left chart 5 days’ time span HIGH and right chart 3 days’ time span HIGH is less than $1.00.
As soon as the 15 min time frame candle completes on the 3 Day Time Span which displays the HIGH bubble and the difference is less than $1.00 from the 5Day time span HIGH I need to know.
[Difference of less than $1.00 from HIGH of 5Day time span and HIGH of 3 day time span]
Its will be same for the LOW as well the difference between the LOW of the 5day time span and 3 day time span is less than $1.00 I need to scan those.
I need the time span and price to be set by input variables where I can change it to different time spans and difference price if needed.
I was trying something like this.
def day3h = high > Highest(high[1],78); [78 is the number of 15 min bars in 3 days tf]
def day5h = high > Highest(high[1],130); [130 is the number of 15 min bars in 5days tf]
def Diff = day5h - day3h;
#def scan3 = if scan2 < 1.00 then Scan1 else scan;
plot Scan = if Diff < 1.00 then day3h else else double.nan;

