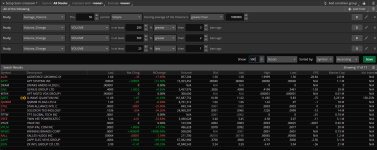
Is it possible to scan for stocks that had a spike in volume and then decreased volume the next day or 3 days later. This is DRUG chart, where there was a spike on Day 1 and bigger on Day 2 and then decrease in volume for 2 days (Day 3 and 4) before another spike on Day 5. Mainly for momentum stocks. So prior spike in volume is greater than twice the volume on the decreased days. The below doesn't look right, so would appreciate any feedback. Thank you
input agg = AggregationPeriod.Day;
def avgvol = Average(volume(period = AggregationPeriod.Day), 50);
plot DecreaseVol = volume[1] > (volume[0]*2) or
volume[2] > (volume[1]*2) or
volume[3] > (volume[2]*2) or
volume[4] > (volume[3]*2) or
volume[5] > (volume[4]*2);

input agg = AggregationPeriod.Day;
def avgvol = Average(volume(period = AggregationPeriod.Day), 50);
plot DecreaseVol = volume[1] > (volume[0]*2) or
volume[2] > (volume[1]*2) or
volume[3] > (volume[2]*2) or
volume[4] > (volume[3]*2) or
volume[5] > (volume[4]*2);
Last edited by a moderator:


