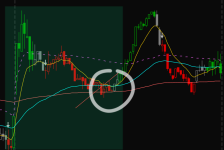
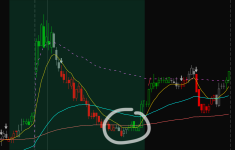
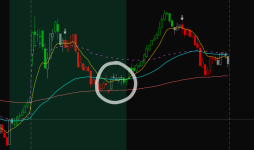
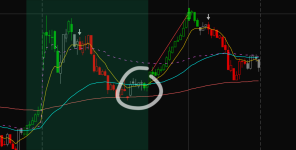
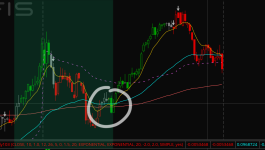
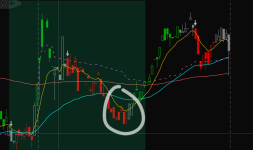
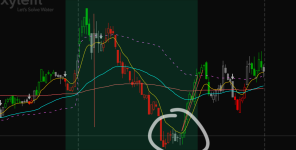
Please see attached. Can someone tell me how to scan for stocks that are currently in the white circled area, where the following happened on a five minute chart:
1. price opened up higher then previous day. Usually with a gap up, but not always
2. after 4, 5, 6 green bars, the price reverted lower to the white circled area
Is there a way to search for this sort of action in the scanner? Or, at the very least can someone tell me how to scan for any stock that gapped up at the open (the gap up scan feature only seems to use the terms "previous bar". If I'm running a scan at, say, noon, I want it still to show me a gap up that happened at the market's open.
Thank you in advance!