Hello All! I'd like help creating a set up that I've been using. There is no source code that i can find, but its from the YouTuber Stock Moe (for credit)
Its comprised of the following: RSI, 5,13,50 EMA, and Bollinger Bands(no middle line)
Here is what i need help with coding
RSI:
RSI OB with a small white X = RSI overbought breaking the 75
RSI OS with a small white X = RSI oversold breaking the 25
EMA Crossings:
5 cross over 13 = Bullish Green diamond or arrow
13 cross over 50 = Bullish Larger green diamond or arrow
5 cross down 13 = Bearish red diamond or arrow
13 cross down 50 = Bearish Larger red diamond or arrow
Bollinger Band:
BB OB with small red candle pointing down = bearish over bought
BB OS with small green candle pointing up = bullish oversold
Confluence Signal: EMA Crossing PLUS RSI crossing 50
5 cross over 13 and EMA + RSI Bullish green label = bullish signal
13 cross over 50 and EMA + RSI Bullish Green label = bullish signal
5 cross under 13 and EMA + RSI Bearish red label = bearish signal
13 cross under 50 and EMA + RSI Bearish red label = bearish signal
your words are vague.
you need to learn to describe things better and say what you want to see on the chart.
if you are referencing some video, post a link
...RSI overbought breaking the 75...
what does this mean?
crossing above or crossing below?
i made it to be crossing above
...5 cross over 13 ...
same thing, this is vague , what direction? to go over a line can mean up or down.
i made it cross above
...BB OB with small red candle pointing down...
BB OB , ? what does this mean ? every candle that is ob? or just when it crosses the ob line?
what is small?
no idea what a pointing candle is
what is price doing? what formula will describe this?
since its a red candle, i made it crosses below
there are only 4 prices, open,high,low,close. and 2 main actions, crosses above and cross below.
you need to get aquainted with them and use them when describing rules.
the final rules don't include bollinger bands?
...#5 cross over 13 and EMA + RSI Bullish green label = bullish signal...
what is 'and ema' ?
rsi label ? nowhere have you mentioned labels.
you did not mention what rsi rule is bullish? maybe i have the rsi rules backwards ?
----------------------
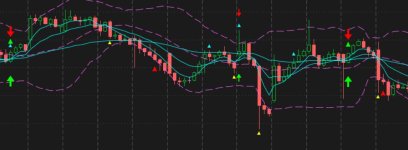
i copied your rules into a new study.
then found each study and copied the code and pasted them in each section, and changed them.
look it over and post comments or more detailed questions.
Code:
#rsi_ema_bb_signals

#https://usethinkscript.com/threads/rsi-ema-bollinger-signal.19693/
#RSI-EMA-Bollinger Signal?

def na = double.nan;
def bn = barnumber();

def grn = close > open;
def red = close < open;
def base = 0.001;

#------------------------------------
#RSI:
#RSI OB with a small white X = RSI overbought breaking the 75
#    rsi crosses above 75
#RSI OS with a small white X = RSI oversold breaking the 25
#    rsi crosses below 25

#declare lower;
input rsi_length = 14;
input rsi_over_Bought = 75;
input rsi_over_Sold = 25;
input rsi_price = close;
input rsi_averageType = AverageType.WILDERS;
def NetChgAvg = MovingAverage(rsi_averageType, rsi_price - rsi_price[1], rsi_length);
def TotChgAvg = MovingAverage(rsi_averageType, AbsValue(rsi_price - rsi_price[1]), rsi_length);
def ChgRatio = if TotChgAvg != 0 then NetChgAvg / TotChgAvg else 0;
def RSI = 50 * (ChgRatio + 1);
def rsi_ob = (rsi crosses above rsi_Over_Bought);
def rsi_os = (rsi crosses below rsi_Over_Sold);
def rsi_xup = rsi crosses above 50;
def rsi_xdwn = rsi crosses below 50;

input show_rsi_bubbles = yes;
addchartbubble(show_rsi_bubbles and rsi_ob, high*1.001, "OB", color.white, yes);
addchartbubble(show_rsi_bubbles and rsi_os, low*0.999, "OS", color.white, no);


#------------------------------------
#EMA Crossings:
#5 cross over 13 = Bullish Green diamond or arrow
#    5 cross above 13
#13 cross over 50 = Bullish Larger green diamond or arrow
#5 cross down 13 = Bearish red diamond or arrow
#    5 crosses below 13
#13 cross down 50 = Bearish Larger red diamond or arrow

def data = close;
input avg1_type = AverageType.exponential;
input avg1_length = 5;
def avg1 = MovingAverage(avg1_type, data, avg1_length );

input avg2_type = AverageType.exponential;
input avg2_length = 13;
def avg2 = MovingAverage(avg2_type, data, avg2_length );

input avg3_type = AverageType.exponential;
input avg3_length = 50;
def avg3 = MovingAverage(avg3_type, data, avg3_length );

input show_avg_lines = yes;
plot zavg1 = if show_avg_lines then avg1 else na;
plot zavg2 = if show_avg_lines then avg2 else na;
plot zavg3 = if show_avg_lines then avg3 else na;
zavg1.SetDefaultColor(Color.cyan);
zavg1.setlineweight(1);
zavg1.hidebubble();
zavg2.SetDefaultColor(Color.cyan);
zavg2.setlineweight(1);
zavg2.hidebubble();
zavg3.SetDefaultColor(Color.cyan);
zavg3.setlineweight(1);
zavg3.hidebubble();

def avg_xup1 = avg1 crosses above avg2;
def avg_xup2 = avg2 crosses above avg3;
def avg_xdwn1 = avg1 crosses below avg2;
def avg_xdwn2 = avg2 crosses below avg3;


plot z1 = if avg_xup1 then (high*(1+(base*2))) else na;
z1.SetPaintingStrategy(PaintingStrategy.TRIANGLES);
#z1.SetPaintingStrategy(PaintingStrategy.ARROW_UP);
z1.SetDefaultColor(Color.cyan);
z1.setlineweight(2);
z1.hidebubble();

plot z2 = if avg_xup2 then (high*(1+(base*4))) else na;
z2.SetPaintingStrategy(PaintingStrategy.TRIANGLES);
z2.SetDefaultColor(Color.green);
z2.setlineweight(5);
z2.hidebubble();

plot z3 = if avg_xdwn1 then (low*(1-(base*2))) else na;
z3.SetPaintingStrategy(PaintingStrategy.TRIANGLES);
z3.SetDefaultColor(Color.yellow);
z3.setlineweight(2);
z3.hidebubble();

plot z4 = if avg_xdwn2 then (low*(1-(base*4))) else na;
z4.SetPaintingStrategy(PaintingStrategy.TRIANGLES);
z4.SetDefaultColor(Color.red);
z4.setlineweight(5);
z4.hidebubble();


#------------------------------------
#Bollinger Band:
#BB OB with small red candle pointing down = bearish over bought
#    ?  a red candle crosses below the upper bb line
#BB OS with small green candle pointing up = bullish oversold
#    ?  a green candle crosses above the lower bb line

input price = close;
input displace = 0;
input length = 20;
input Num_Dev_Dn = -2.0;
input Num_Dev_up = 2.0;
input averageType = AverageType.Simple;
def sDev = stdev(data = price[-displace], length = length);
def bbMid = MovingAverage(averageType, data = price[-displace], length = length);
def bbUpper = bbMid + num_Dev_Up * sDev;
def bbLower = bbMid + num_Dev_Dn * sDev;

input show_bb_lines = yes;
plot MidLine = if show_bb_lines then bbmid else na;
plot UpperBand = bbupper;
plot LowerBand = bblower;

midline.SetStyle(Curve.MEDIUM_DASH);
lowerband.SetStyle(Curve.MEDIUM_DASH);
upperband.SetStyle(Curve.MEDIUM_DASH);
LowerBand.SetDefaultColor(GetColor(0));
MidLine.SetDefaultColor(GetColor(0));
UpperBand.SetDefaultColor(GetColor(0));

#def xup2 = avg2 crosses above avg3;
#def xdwn1 = avg1 crosses below avg2;

# bbob   ?  a red candle crosses below the upper bb line
# bbos   ?  a green candle crosses above the lower bb line

def bbob = red and close crosses below bbupper;
def bbos = grn and close crosses above bblower;


#------------------------------------
#Confluence Signal: EMA Crossing PLUS RSI crossing 50

#5 cross over 13 and EMA + RSI Bullish green label = bullish signal
#13 cross over 50 and EMA + RSI Bullish Green label = bullish signal
#5 cross under 13 and EMA + RSI Bearish red label = bearish signal
#13 cross under 50 and EMA + RSI Bearish red label = bearish signal

def bull1 = avg_xup1 and rsi_xup;
def bull2 = avg_xup2 and rsi_xup;
plot b1 = if bull1 then (low*(1-(base*6))) else na;
b1.SetPaintingStrategy(PaintingStrategy.arrow_up);
b1.SetDefaultColor(Color.green);
b1.setlineweight(2);
b1.hidebubble();
plot b2 = if bull2 then (low*(1-(base*6))) else na;
b2.SetPaintingStrategy(PaintingStrategy.arrow_up);
b2.SetDefaultColor(Color.green);
b2.setlineweight(5);
b2.hidebubble();


def bear1 = avg_xdwn1 and rsi_xdwn;
def bear2 = avg_xdwn2 and rsi_xdwn;
plot b3 = if bull1 then (high*(1+(base*6))) else na;
b3.SetPaintingStrategy(PaintingStrategy.arrow_down);
b3.SetDefaultColor(Color.red);
b3.setlineweight(2);
b3.hidebubble();
plot b4 = if bull2 then (high*(1+(base*6))) else na;
b4.SetPaintingStrategy(PaintingStrategy.arrow_down);
b4.SetDefaultColor(Color.red);
b4.setlineweight(5);
b4.hidebubble();
#
#
useThinkScript is the #1 community of stock market investors using indicators and other tools to power their trading strategies. Traders of all skill levels use our forums to learn about scripting and indicators, help each other, and discover new ways to gain an edge in the markets.
How do I get started?
We get it. Our forum can be intimidating, if not overwhelming. With thousands of topics, tens of thousands of posts, our community has created an incredibly deep knowledge base for stock traders. No one can ever exhaust every resource provided on our site.
If you are new, or just looking for guidance, here are some helpful links to get you started.
VIP members get exclusive access to these proven and tested premium indicators: Buy the Dip, Advanced Market Moves 2.0, Take Profit, and Volatility Trading Range. In addition, VIP members get access to over 50 VIP-only custom indicators, add-ons, and strategies, private VIP-only forums, private Discord channel to discuss trades and strategies in real-time, customer support, trade alerts, and much more. Learn all about VIP membership here.
How can I access the premium indicators?
To access the premium indicators, which are plug and play ready, sign up for VIP membership here.