mod note:
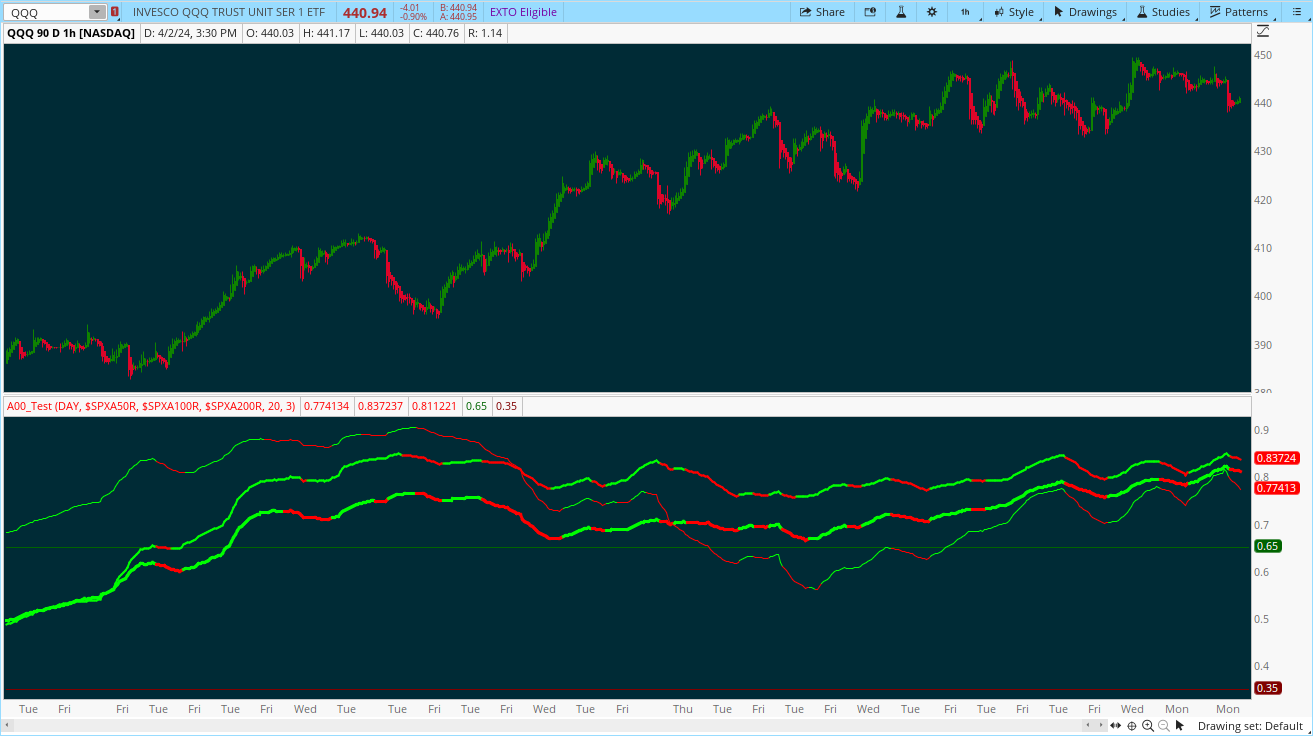
This study provides insights into market trends and helps gauge the overall health and direction of the stock market.
Interaction between these different moving averages, identifies potential entry and exit points for trades, and assesses the strength of market trends.
Additionally, the combination of multiple moving averages offers a broader perspective on market movements and can help smooth out short-term fluctuations, providing a clearer picture of long-term trends.

Hi all,
I am completely new to Thinkorswim and thinkScript. I wonder if something like Ribbon % OF stocks above 20/50/100/200 DayMA S&P500
https://www.tradingview.com/script/RC1eyBAa-Ribbon-OF-stocks-above-20-50-100-200-DayMA-S-P500/
is available in the studies/strategies. I didn't see it, but maybe it is available but in a different name?
Thanks,
Nirgalli
This study provides insights into market trends and helps gauge the overall health and direction of the stock market.
Interaction between these different moving averages, identifies potential entry and exit points for trades, and assesses the strength of market trends.
Additionally, the combination of multiple moving averages offers a broader perspective on market movements and can help smooth out short-term fluctuations, providing a clearer picture of long-term trends.

Hi all,
I am completely new to Thinkorswim and thinkScript. I wonder if something like Ribbon % OF stocks above 20/50/100/200 DayMA S&P500
https://www.tradingview.com/script/RC1eyBAa-Ribbon-OF-stocks-above-20-50-100-200-DayMA-S-P500/
is available in the studies/strategies. I didn't see it, but maybe it is available but in a different name?
Thanks,
Nirgalli
Last edited by a moderator:
