
find peaks and valleys on 2 stocks. (default 2nd is SPY)
draw lines between the peaks and between the valleys of stock 1 (chart symbol).
color parts of the lines cyan if the slope is divergent, to the 2nd stock slope.
a peak (and valley) is found when current bar is higher than 10 bars before and 10 bars after it.
can turn on lines for the 2nd stock (but, they probably will be at a different price range so will compress the chart bars.
dots are drawn for the peaks and valleys on stock 1.
triangles can te turned on for the peaks and valleys on stock 2.
reply to this Q
https://usethinkscript.com/threads/compare-two-instruments.15757/#post-116612
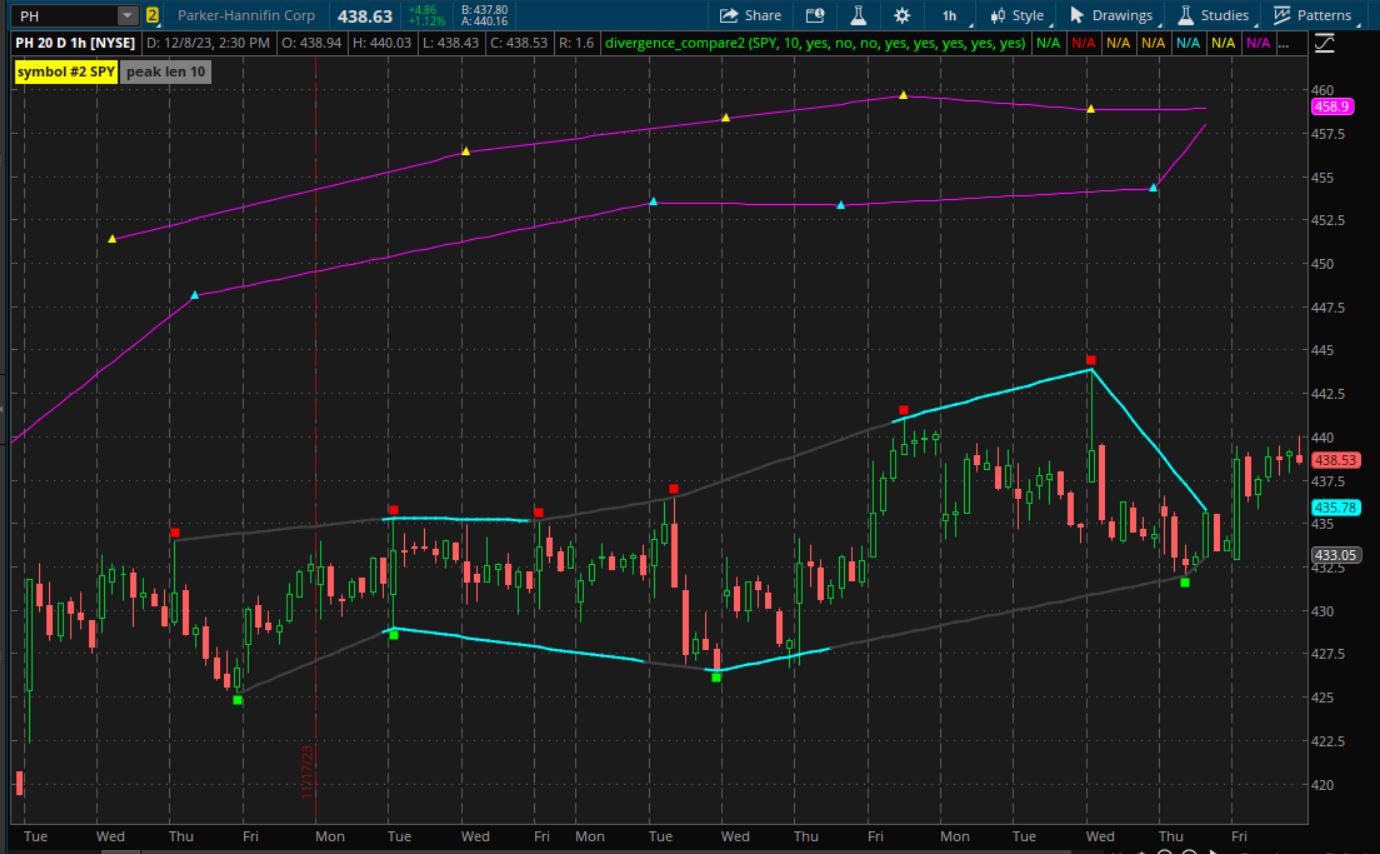
this shows purple lines for stock 2, above the candles.
when the purple lines are divergent to the lines on candles, the bottom lines will be cyan.
hal_div
draw lines between the peaks and between the valleys of stock 1 (chart symbol).
color parts of the lines cyan if the slope is divergent, to the 2nd stock slope.
a peak (and valley) is found when current bar is higher than 10 bars before and 10 bars after it.
can turn on lines for the 2nd stock (but, they probably will be at a different price range so will compress the chart bars.
dots are drawn for the peaks and valleys on stock 1.
triangles can te turned on for the peaks and valleys on stock 2.
reply to this Q
https://usethinkscript.com/threads/compare-two-instruments.15757/#post-116612
Code:
# divergence_compare2

# find peaks, of 2 stocks
# find slopes , compare. if diff then diverge

#------------------------------
#https://usethinkscript.com/threads/compare-two-instruments.15757/#post-116612
# post4
#------------------------------
# ref
# https://researchtrade.com/forum/read.php?7,2258,page=19
# Robert Payne
#------------------------------
def na = double.nan;
def bn = barnumber();
def n = 200;

input second_symbol = "SPY";
input magnitude = 10;
def lastxbars = !isnan(getvalue(close, -(magnitude-1)));

addlabel(1, "symbol #2 " + second_symbol, color.yellow);
addlabel(1, " peak len " + magnitude + " ", color.gray);

#-------------------------------------------------------

# p1 - stock 1 peaks
# v1 - stock 1 valleys
# p2 - stock 2 peaks
# v2 - stock 2 valleys

#==================================================
# chart - stock 1

#-----------------------------
# find peaks/valleys

def op1 = open;
def hi1 = high;
def lo1 = low;
def cl1 = close;

#input magnitude = 10;
#addlabel(1, " peak len " + magnitude + " ", color.gray);

def peak1 = hi1 > Highest(hi1[1], magnitude) and hi1 >= Highest(hi1[-magnitude], magnitude);
def valley1 = lo1 < Lowest(lo1[1], magnitude) and lo1 <= Lowest(lo1[-magnitude], magnitude);

def y2 = 0.001;
#def y2 = 0;
input symbol1_peaks_valleys_dots = yes;
plot zv1 = if symbol1_peaks_valleys_dots and valley1 then lo1*(1-y2) else na;
#zv1.SetPaintingStrategy(PaintingStrategy.ARROW_UP);
#zv1.SetPaintingStrategy(PaintingStrategy.points);
zv1.SetPaintingStrategy(PaintingStrategy.squares);
zv1.SetDefaultColor(Color.green);
zv1.setlineweight(4);
zv1.hidebubble();

plot zp1 = if symbol1_peaks_valleys_dots and peak1 then hi1*(1 +y2) else na;
#zp1.SetPaintingStrategy(PaintingStrategy.ARROW_DOWN);
#zp1.SetPaintingStrategy(PaintingStrategy.points);
zp1.SetPaintingStrategy(PaintingStrategy.squares);
zp1.SetDefaultColor(Color.red);
zp1.setlineweight(4);
zp1.hidebubble();

#-----------------------------
#---------- peaks ------------
# if a peak, look for next future peak

def p1nextoff;
def p1nextbn;
def p1nextpr;
def p1slope;
def p1line;
if peak1 then {
# look for offset to next peak
 p1nextoff = fold a = 1 to n
  with p = 1
  while !getvalue(peak1, -a)
  do p + 1;
 p1nextbn = bn + p1nextoff;
 p1nextpr = GetValue(hi1, -p1nextoff);
 p1slope = (p1nextpr - hi1)/p1nextoff;
 p1line = hi1;
} else {
 p1nextoff = p1nextoff[1];
 p1nextbn = p1nextbn[1];
 p1nextpr = p1nextpr[1];
 p1slope = p1slope[1];
 p1line = p1line[1] + p1slope;
}

def y1 = 0.4;
input test_p1_line = no;
plot z1 = if test_p1_line and p1line > 0 and !isnan(cl1) and lastxbars then p1line + y1 else na;
z1.SetDefaultColor(Color.orange);


#-----------------------------
# ------ valley --------------
# if a valley, look for next future valley

def v1nextoff;
def v1nextbn;
def v1nextpr;
def v1slope;
def v1line;
if valley1 then {
# look for offset to next valley
 v1nextoff = fold b = 1 to n
  with q = 1
  while !getvalue(valley1, -b)
  do q + 1;
 v1nextbn = bn + v1nextoff;
 v1nextpr = GetValue(lo1, -v1nextoff);
 v1slope = (v1nextpr - lo1)/v1nextoff;
 v1line = lo1;
} else {
 v1nextoff = v1nextoff[1];
 v1nextbn = v1nextbn[1];
 v1nextpr = v1nextpr[1];
 v1slope = v1slope[1];
 v1line = v1line[1] + v1slope;
}

input test_v1_line = no;
plot z2 = if test_v1_line and v1line > 0 and !isnan(cl1) and lastxbars then v1line - y1 else na;
z2.SetDefaultColor(Color.orange);

#==================================================
#==================================================
# 2nd symbol - stock 2

# second_symbol
def op2 = open(second_symbol);
def hi2 = high(second_symbol);
def lo2 = low(second_symbol);
def cl2 = close(second_symbol);

#-----------------------------
# find peaks/valleys of 2nd symbol

def peak2 = hi2 > Highest(hi2[1], magnitude) and hi2 >= Highest(hi2[-magnitude], magnitude);
def valley2 = lo2 < Lowest(lo2[1], magnitude) and lo2 <= Lowest(lo2[-magnitude], magnitude);

input symbol2_peaks_valleys_triangles = no;
plot zv2 = if symbol2_peaks_valleys_triangles and valley2 then lo2 else na;
zv2.SetPaintingStrategy(PaintingStrategy.triangles);
zv2.SetDefaultColor(Color.cyan);
zv2.setlineweight(2);
zv2.hidebubble();

plot zp2 = if symbol2_peaks_valleys_triangles and peak2 then hi2 else na;
zp2.SetPaintingStrategy(PaintingStrategy.triangles);
zp2.SetDefaultColor(Color.yellow);
zp2.setlineweight(2);
zp2.hidebubble();

#---------------------------------------
#---------- peaks , 2nd symbol ---------
# if a peak, look for next future peak

def p2nextoff;
def p2nextbn;
def p2nextpr;
def p2slope;
def p2line;
if peak2 then {
# look for offset to next peak
 p2nextoff = fold c = 1 to n
  with r = 1
  while !getvalue(peak2, -c)
  do r + 1;
 p2nextbn = bn + p2nextoff;
 p2nextpr = GetValue(hi2, -p2nextoff);
 p2slope = (p2nextpr - hi2)/p2nextoff;
 p2line = hi2;
} else {
 p2nextoff = p2nextoff[1];
 p2nextbn = p2nextbn[1];
 p2nextpr = p2nextpr[1];
 p2slope = p2slope[1];
 p2line = p2line[1] + p2slope;
}

input test_p2_line = no;
plot z3 = if test_p2_line and p2line > 0 and !isnan(close) and lastxbars then p2line else na;
z3.SetDefaultColor(Color.magenta);


#---------------------------------------
# ------ valleys , 2nd symbol ----------
# if a valley, look for next future valley

def v2nextoff;
def v2nextbn;
def v2nextpr;
def v2slope;
def v2line;
if valley2 then {
# look for offset to next valley
 v2nextoff = fold d = 1 to n
  with s = 1
  while !getvalue(valley2, -d)
  do s + 1;
 v2nextbn = bn + v2nextoff;
 v2nextpr = GetValue(lo2, -v2nextoff);
 v2slope = (v2nextpr - lo2)/v2nextoff;
 v2line = lo2;
} else {
 v2nextoff = v2nextoff[1];
 v2nextbn = v2nextbn[1];
 v2nextpr = v2nextpr[1];
 v2slope = v2slope[1];
 v2line = v2line[1] + v2slope;
}

input test_v2_line = no;
plot z4 = if test_v2_line and v2line > 0 and !isnan(cl2) and lastxbars then v2line else na;
z4.SetDefaultColor(Color.magenta);


#==================================================
# compare slopes

def limit = 8;
# divergence of peak slopes
def pdiv = (p1slope * p2slope);
input peak_divergent_line = yes;
plot z5 = if peak_divergent_line and p1line > limit and !isnan(cl1) and lastxbars then p1line else na;
z5.AssignValueColor(if pdiv < 0 then color.cyan else color.dark_gray);
z5.setlineweight(2);

# divergence of valley slopes
def vdiv = (v1slope * v2slope);
input valley_divergent_line = yes;
plot z6 = if valley_divergent_line and v1line > limit and !isnan(cl2) and lastxbars then v1line else na;
z6.AssignValueColor(if vdiv < 0 then color.cyan else color.dark_gray);
z6.setlineweight(2);

#-----------------------
addchartbubble(0, low*0.99,
v1line[1] + "\n" +
v1slope + "\n" +
v1line
, color.yellow, no);

#
this shows purple lines for stock 2, above the candles.
when the purple lines are divergent to the lines on candles, the bottom lines will be cyan.
hal_div
Last edited: