I found a simple strategy from Casey ( Learn2Trading in Twitter). Please refer the attachment for more details.
Script should plot.
If price is between Premarket High and Premarket Low , candles can be grey as it could be choppy.
Thanks,
Kitcha.
Script should plot.
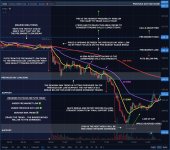
- Plots 13 EMA (yellow), 48 EMA (magenta), 200 EMA (red).
- Plots Previous Day High/Low and Pre-Market High/Low zone. Highlight it based on 5 min handle.
- Calls above Premarket High and Puts below Premarket Below
- If price is above Premarket High and Previous Day High , it is bullish and if price is below Premarket Low and Previous Day Low. It is bearish.
If price is between Premarket High and Premarket Low , candles can be grey as it could be choppy.
Thanks,
Kitcha.